Entry 12: When the Weather Outside is Frightful…

In a previous post, I noted that while there is an endless variety of recommendations on how to prepare for an Ironman, the common thread amongst many coaches is that ahead of any specific guidance on training intensity or volume, training consistency is perhaps the most important determinant of success.  Given that triathlon is predominantly an outdoor sport, one of the key points of friction to training consistency is naturally the weather.  Fully acknowledging the irony that spring (and with it, hopefully some racing!) is finally upon us here in the northern hemisphere, in this post we will explore the various options that I have found most helpful over the past few seasons when the weather outside was less than cooperative.

Swim:

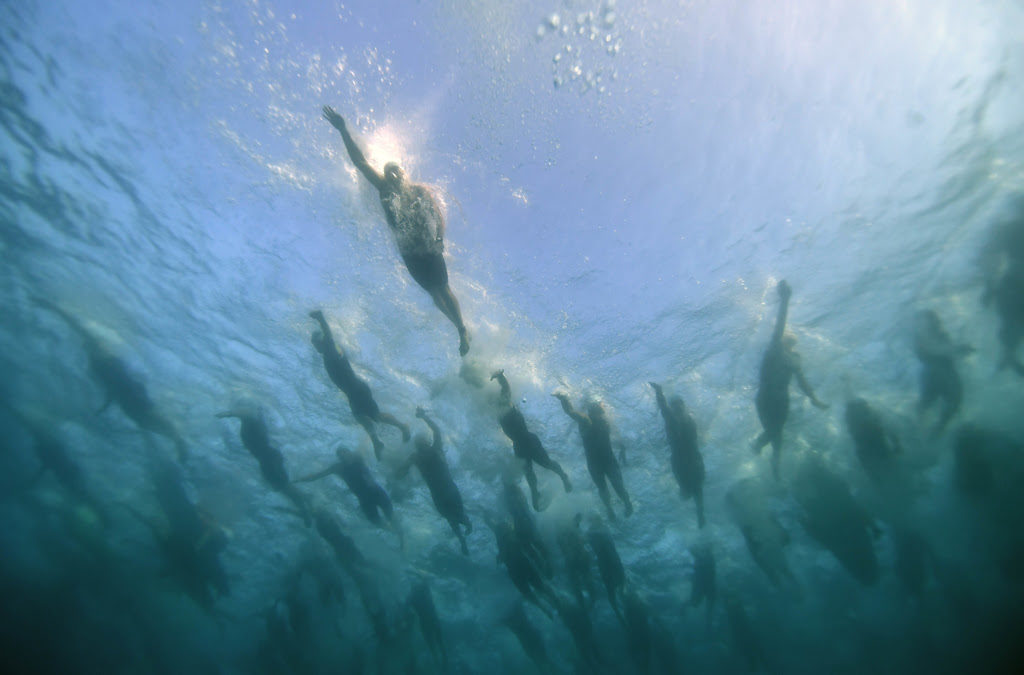
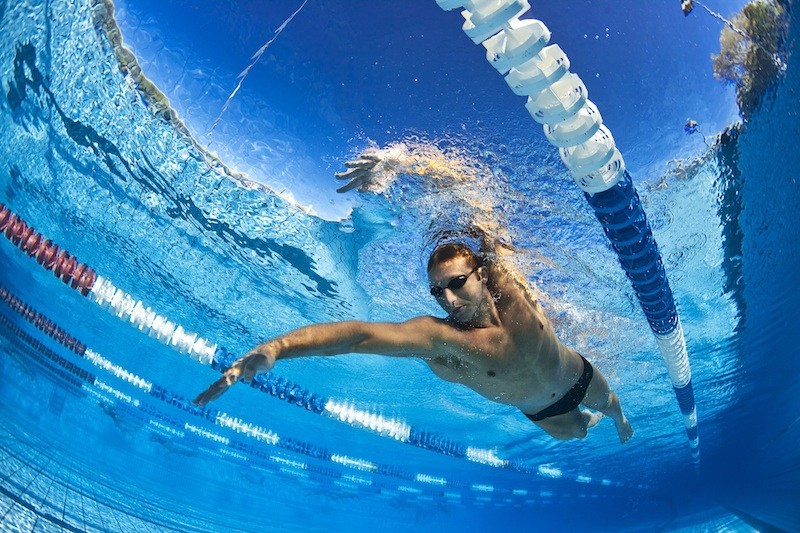
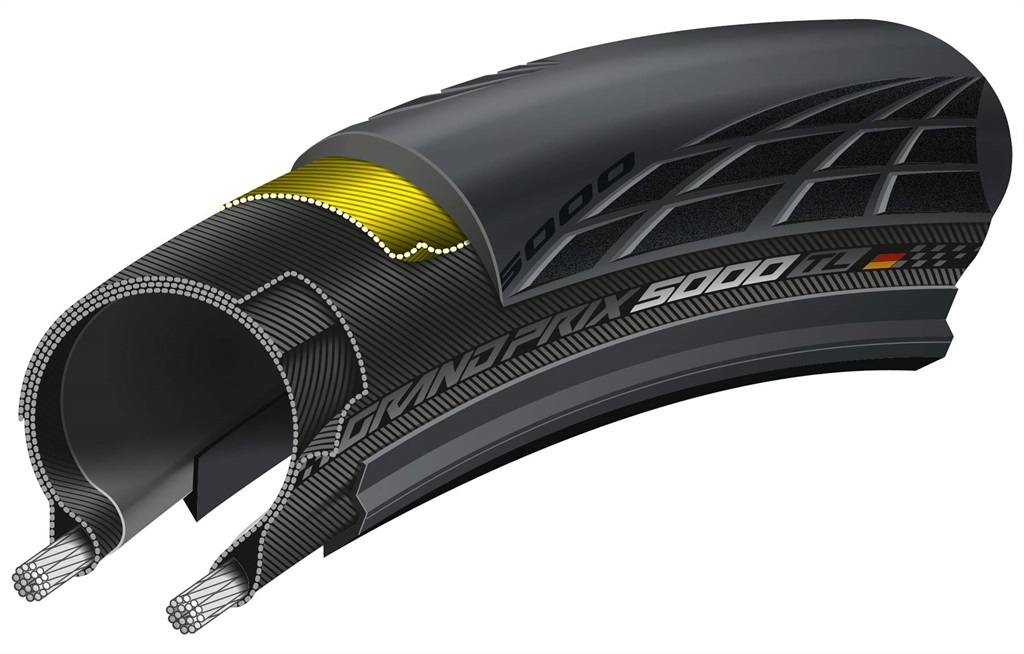
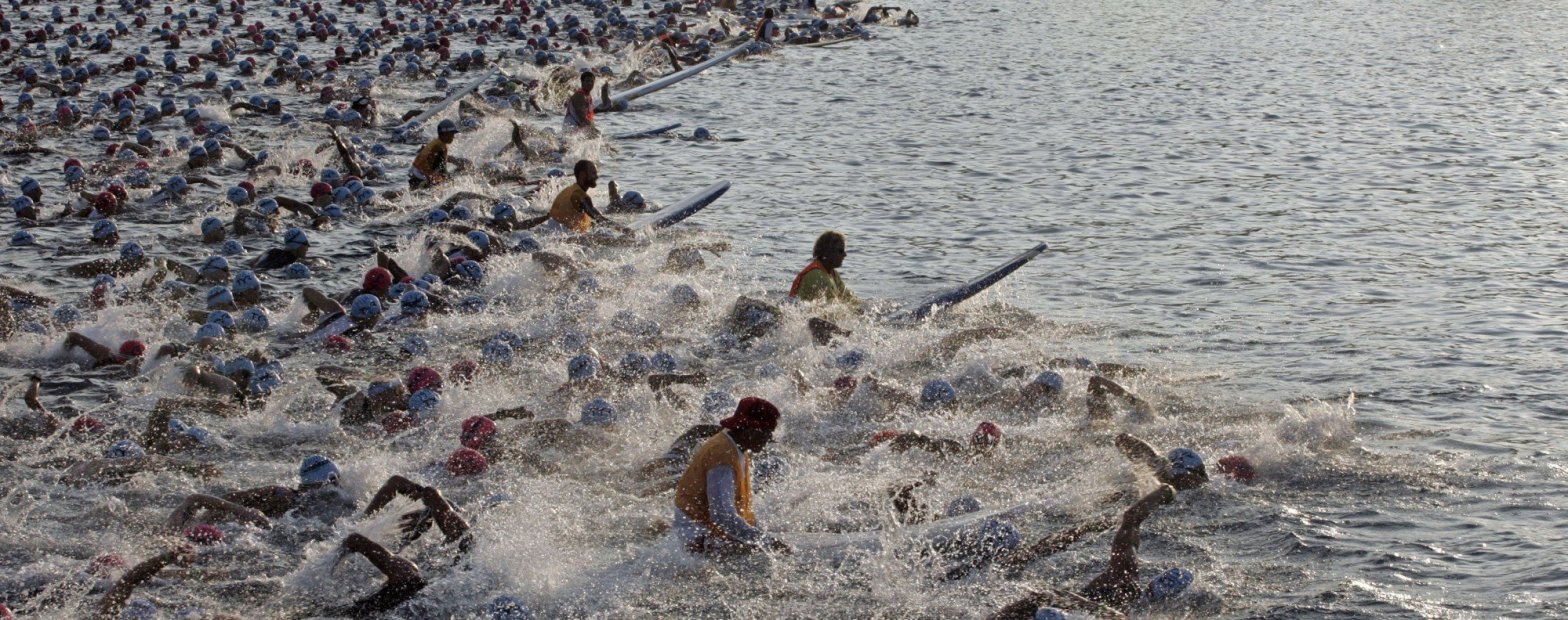
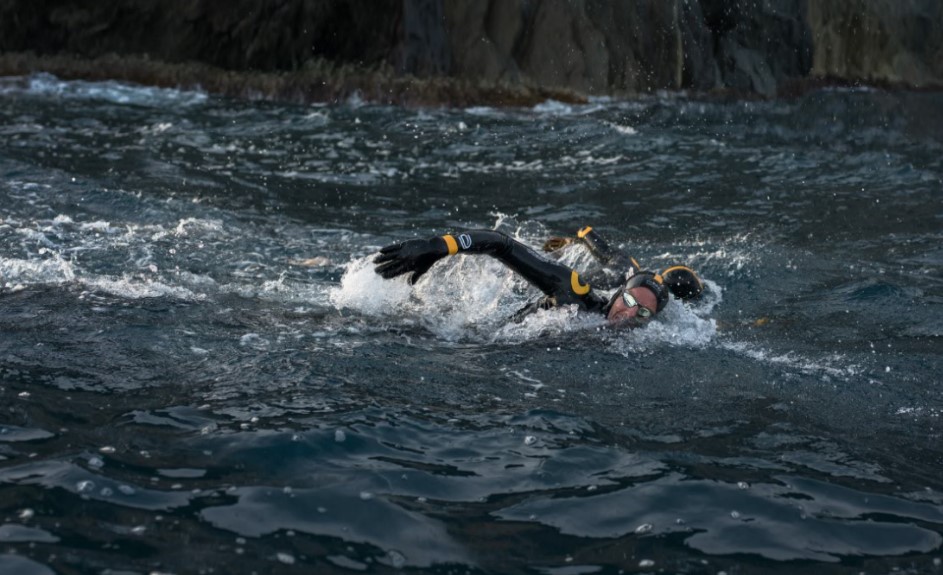
While open water swimming becomes an important factor closer to race day (typically during the late spring and summer), the bread and butter of swim training typically takes place in the controlled environment of the indoor pool.  Nevertheless, recent pool closures due to COVID19 lockdowns have forced many athletes to improvise, including, for some brave souls, hitting the beach during the colder months.  This is entirely feasible with the appropriate equipment, namely thermal wetsuits, insulated caps, gloves, and booties.  While standard wetsuits can provide adequate insulation down to 55-60° Fahrenheit (12-16° Celsius), thermal wetsuits can in some cases be used in arctic conditions, although more race-focused models are usually rated down to 45-50° Fahrenheit (7-10° Celsius).  These are routinely used at races such as the Isklar Norseman Xtreme Triathlon, an Ironman-distance event where the swim takes place in a Norwegian fjord that is known to get as cold as 50° Fahrenheit (10° Celsius).  The Norseman is generally considered one of the most challenging race courses in the world.

Bike:

Before diving into this topic, it is necessary for me to invoke rule #9 issued by the Velominati (cycling’s definitive governing body): https://www.velominati.com/:

#9: If you are out riding in bad weather, it means you are a badass. Period.  Fair-weather riding is a luxury reserved for Sunday afternoons and wide boulevards. Those who ride in foul weather – be it cold, wet, or inordinately hot – are members of a special club of riders who, on the morning of a big ride, pull back the curtain to check the weather and, upon seeing rain falling from the skies, allow a wry smile to spread across their face. This is a rider who loves the work.

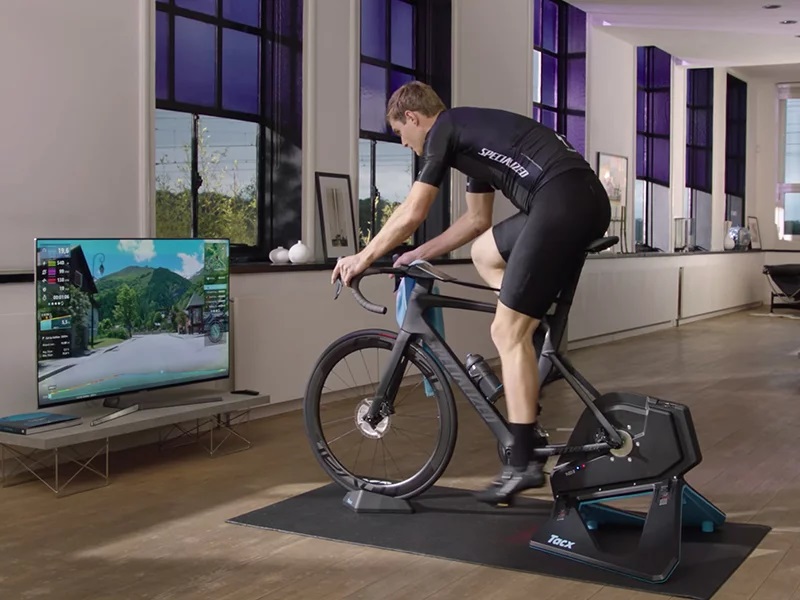
With that disclaimer out of the way, while there may be some riders out there with the cojones to ride year-round, the risk of catastrophic injury due to black ice, narrow road shoulders, and windchill are such that I have generally opted to do my winter riding indoors.  Over the past few years, extensive progress has been made in both software and hardware to make the indoor riding experience significantly more tolerable. 

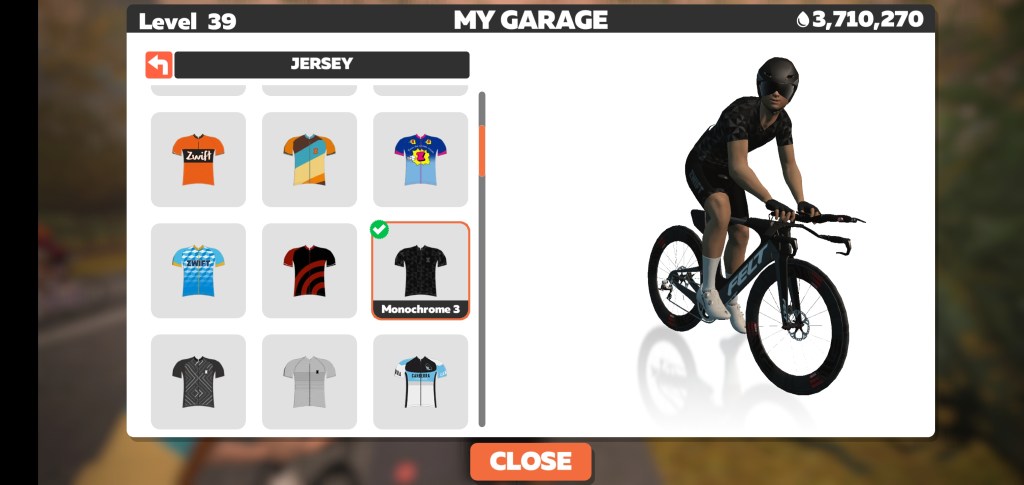
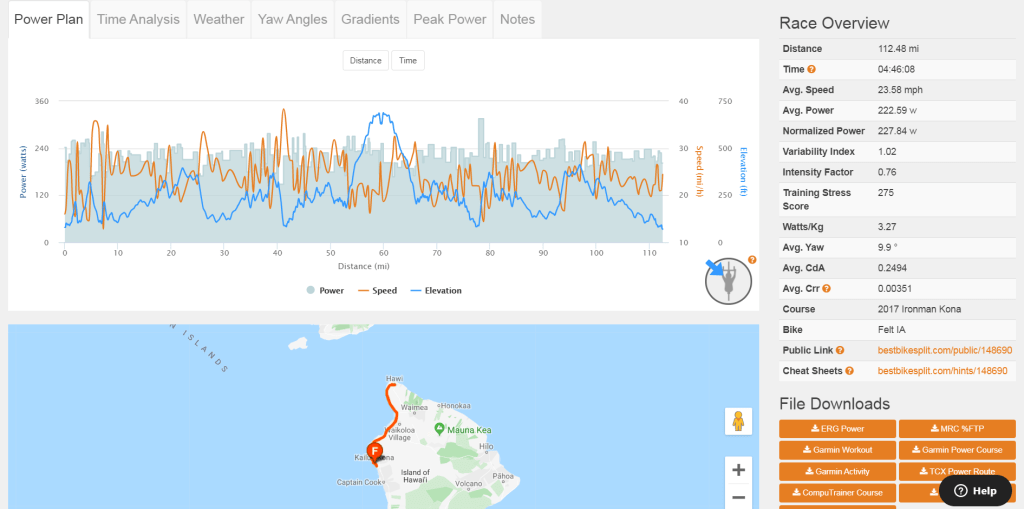
  • Software: over the past few seasons, I have extensively utilized Zwift, which is a computer program that provides a variety of immersive virtual courses where cyclists can train.  Zwift also has a number of social features which enable athletes to organize group rides with their friends as well as race with fellow competitors worldwide.  As of February 2021, Zwift has over 3 million subscribers around the world, with peak volumes of 45,000 simultaneous users.  To incentivize greater participation, Zwift has “gamified” the training experience by setting up a virtual currency within the platform which users can earn through the accumulation of mileage and unlocking various achievements (e.g. winning races).  This currency can then be used to purchase virtual gear and outfits.  To date, I have personally logged over 21,000 miles on Zwift, hit the max level cap, and managed to unlock the bike setup that I intend to use at Kona.  It should be noted that Zwift is not the only virtual cycling platform.  Other products available in the market include TrainerRoad, TheSufferFest, Rouvy, BKool, and FulGaz.
Zwift marketing
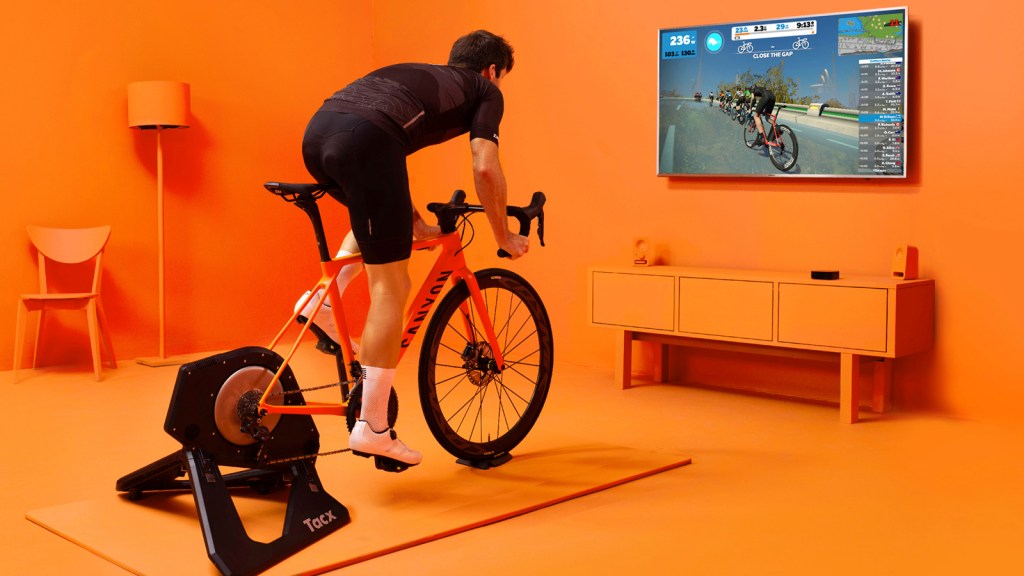
  • Hardware: In order to participate on these software platforms, one generally needs to use an indoor bike trainer, which either comes as a standalone unit or as a bolt-on to one’s outdoor bike setup.  Cheaper “dumb” trainer options simply provide a pre-set ramp of resistance to pedal against.  Higher-end “smart” trainers provide additional immersive elements such as grade changes (e.g. climbing a 10% grade hill in Zwift results in the trainer automatically adding resistance) or road surface simulation.  In addition, smart trainers also offer the option of “erg” mode, which locks the rider into a preset power output, backing off the resistance if the rider pedals too quickly and applying additional resistance if the rider pedals too slowly.  I have found this feature immensely useful for maintaining my power targets during sessions involving longer, submaximal intervals.  A word of warning however: erg-mode can be highly demoralizing when used for high-intensity interval sessions above threshold due to the affectionately-named “spiral of death”.  In this situation, a tired rider who is no longer able to maintain the preset power target naturally slows down his pedaling cadence.  In response to this reduction in cadence, the trainer increases its resistance, which can result in a cascading feedback loop that forces the rider to come to a grinding halt.   For this reason, I generally opt out of erg mode for high intensity sessions. 

It is well known amongst coaches and physiologists that most cyclists are not able to generate the same power output indoors as they can outdoors.  This can generally be attributed to two main factors:

  • Heat: when riding outdoors, cyclists benefit from the cooling effect of the oncoming rush of air as long as they maintain a respectable speed.  This is not the case when riding indoors as one is pedaling in a static position.  In order the stay cool, the body is forced to sweat more (resulting in greater dehydration) and to send additional blood to the skin instead of the working muscles.  One way to partially mitigate this reduction in performance is to install a powerful fan for one’s indoor setup, which greatly assists the body’s ability to shed heat through increased airflow. 
  • Flywheel inertia: While all cyclists strive to achieve as even a pedal stroke as possible, the reality is that every pedal stroke is made up of many micro-accelerations and decelerations.  When one stops or slows down one’s pedal stroke when cycling outside, the rear wheel / hub continues to spin in accordance to Newton’s first law (an object in motion stays in motion unless acted upon by an outside force).  As a result, the amount of additional power needed to maintain a specific wheel / hub speed is relatively small.  Many indoor trainers lack this inertia however, the worst offenders being gym spin bikes which utilize either physical pads or magnets to apply resistance directly to the hub.  Because their hubs slow down materially faster when one’s pedal stroke decelerates, these trainers require more effort from the rider to maintain a specific wheel / hub speed.   As such, the best way to mitigate this issue is to purchase an indoor trainer that has a very heavy flywheel that can simulate the inertia of outdoor riding.  These do tend to be more expensive and (unsurprisingly) more difficult to transport. 

In terms of my personal setup, I currently use the Tacx Neo 2, which is a smart trainer with a heavy flywheel and a good reputation for power accuracy.  This is directly hooked up to Zwift onto which I have manually uploaded my prescribed workouts (typically executed in erg mode except my VO2Max sessions).  In front of this I have a desk which holds a fan for cooling as well as a laptop / iPad for entertainment.  To pass the time, for shorter sessions, I typically listen to audiobooks and podcasts (e.g. That Triathlon Show, TrainerRoad, and MX Endurance), while on longer sessions I usually watch movies and TV shows.  Having completely emptied the Amazon / Netflix / HBO archives, any content suggestions would be much appreciated!

My pain cave

Cycling indoors no doubt has many advantages.  In addition to providing a way to train in inclement weather, it also significantly reduces the setup time between rides and provides a safe environment free of car traffic and traffic lights that allows athletes to more closely hit their prescribed intervals.  That being said, this is not to completely rule out the utility of outdoor rides, which are essential for developing bike handling skills, pacing, as well as race day tactics. 

Run:

Unlike with cycling, I have found that running outdoors throughout the year is completely viable in all but the most extreme of weather conditions and is generally a matter of dressing appropriately.  In the below table, I have laid out what I have generally worn outdoors across various temperature ranges (note: my thicker-skinned colleagues in the American mid-west and Canada will likely claim that they can run in shorts at below freezing temperatures). 

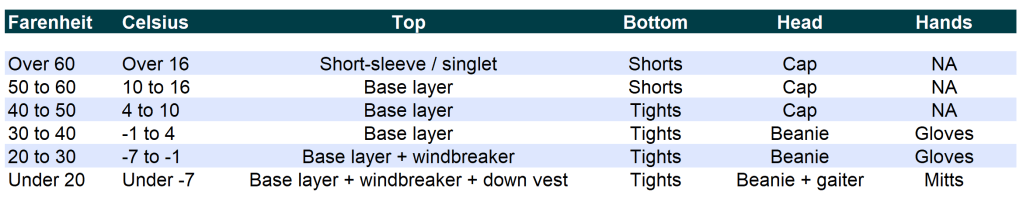
As a general rule of thumb, I have found that dressing in what one would normally wear on a casual basis if the temperature was between 15-20 degrees Fahrenheit (8-11 degrees Celsius) warmer to be good guidance.  Historically, I have found that if I feel a little chilly prior to warming up, I have usually  dressed appropriately.  This ensures that the body does not overheat while running, which can produce excess sweat that can be dangerous if one is forced to stop in the middle of a session on a cold day.  For this reason, one should also consider a lighter wardrobe for harder run sessions as these will produce more body heat.  For runs involving heavy rain or snow and ice, swapping out one’s trainers for a set of light trail shoes can go a long way in terms of providing protection against the elements as well as increased traction.

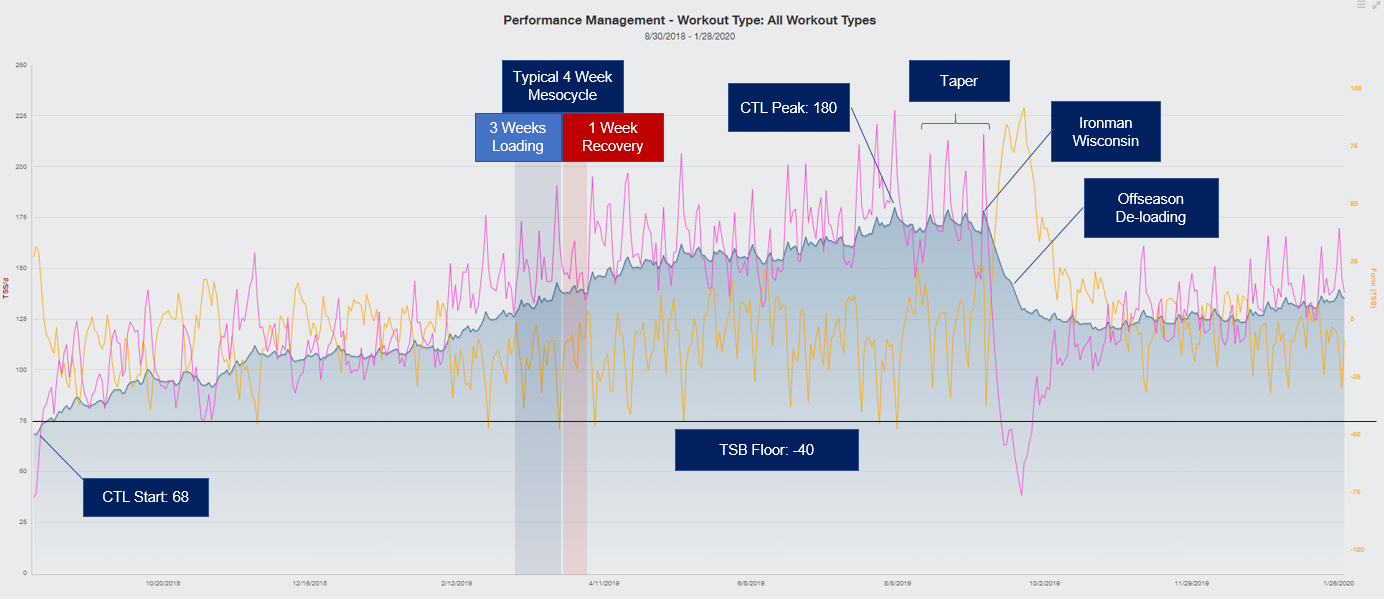
Treadmill running can also be an effective training tool and was something I utilized extensively in the preparation for Ironman Wisconsin, making up the majority of my run training.  In addition to allowing the user to lock-in a pace, similar to indoor bike training, treadmills provide a highly controlled environment where one can execute one’s intervals with greater precision free of interruptions.  However, I would like to point out two pitfalls that I have encountered from treadmill training.  First, spending too much time on the perfectly even surface of a treadmill can allow one’s stabilizer muscles in the ankles and hips to atrophy, leaving athletes more vulnerable to injury when running on more typical road conditions.  Second, I have found that the belt speed of various treadmills even of the same make/model in the same gym can be very different from what they project on-screen and to each other.  For this reason, I have historically set my treadmill speed based on the reading of my Stryd footpod, which I use as my standard of comparison. 

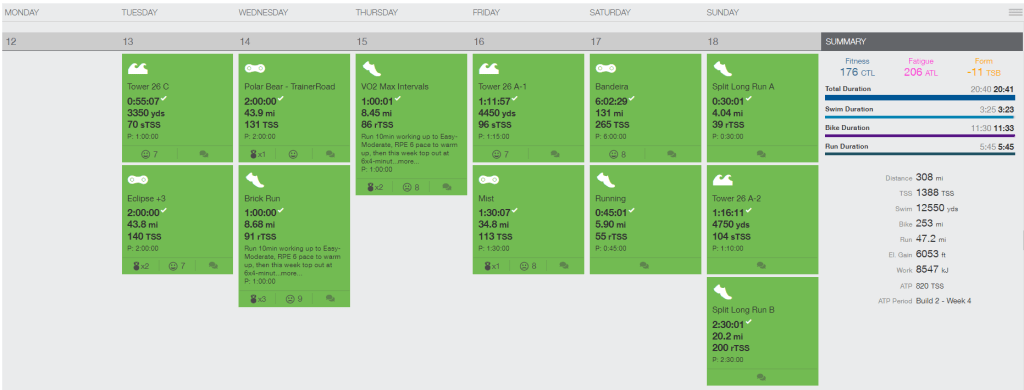
In my next post, we will explore the various mistakes and setbacks I have encountered along the way in my journey to Kona as well as what I learned in process.  In the meantime, for those of you who would like to follow my training progress, most of my sets can be found on my Strava account at: https://www.strava.com/athletes/15134014.

#dacakeisalie

Entry 11: Triathlon Hijinks

Like many other sports, triathlon has a vibrant community of athletes whose habits and mannerisms may at times seem odd or downright comical to outsiders.  Having spent a great deal of time over the ten blog posts covering the technical details of my journey to Kona, it is about time that we explore some of the more lighthearted elements of the sport that I have encountered along the way.  We will also explore the ways that such habits differ between triathletes and dedicated swimmers, cyclists, and runners. 

Overview

Upon arriving at Lake Placid for my first Ironman back in 2018, a friend remarked: “my god, this is a festival for crazy people!”  This statement is not without basis, as the sport does tend to attract folks who could be described as (i) type A (i.e. highly motivated but more accurately characterized as neurotic), (ii) attentive to detail and numbers-focused (anal), and (iii) gritty (masochistic).  The following video is an old classic that does a wonderful job of portraying this personality. 

Along the same vein, 220Triathlon circulated a fun list of 10 reasons why one should never date a triathlete.  My friends and family can certainly attest to most if not all of these points.  My personal favorite is #9: “There is literally nothing in the world more unpredictable and annoying than a tapering triathlete who will be variously moody, irrational, full of self-doubt, obsessed with the weather, germaphobic, restless, excited and anxious – otherwise known as a pain-in-the-ass.”

Spotting a triathlete in the wild is a relatively straightforward affair.  Besides the dead give-away of the person in question wearing some form of race swag (definitely guilty of this myself; we triathletes are a narcissistic bunch), I have personally found that the most reliable identification method is the specific combination of (i) wearing a Garmin / similar fitness tracker and (ii) shaved legs, at least for male triathletes.  The logic is as follows:

  • Garmin: Runners use this to track their splits but swimmers and cyclists generally do not, instead utilizing pool-side clocks and bike-mounted computers respectively
  • Shaved legs: Shaved legs provide a significant hydro/aerodynamic benefit for swimmers and cyclists but are far less important for runners

Wearing knee-high compression socks in public is also usually a pretty reliable giveaway.  These methods are based upon my experience and I personally challenge my readers to inform me of other ways they have used to spot triathletes in the crowd.

Swimming:

When visiting the local lap pool, one would probably notice the exceptionally fast guy/gal in the middle lane whose stroke looks effortless and smooth.  To be clear, that guy/gal is not a triathlete.  The triathlete is more likely the person loudly thrashing around in lane 5.

In all seriousness, unlike dedicated swimmers who have logged countless early mornings and tens of thousands of meters per week from an early age, the vast majority of age-group triathletes are adult-onset swimmers who have yet to achieve the same elasti-man levels of mobility and rhythm.  This is compounded by the fact that triathletes also have to run, resulting in stiffer ankles and legs that tend to sink in the water. 

Michael Phelps Swimming GIF by Team USA - Find & Share on GIPHY
Good luck getting a triathlete to do this

Even at the pro-level, the fact that most triathlon races occur in open water which can be subject to windy and wavy conditions favors a choppier, windmill-like stroke style which looks very different from the classic, glidy-er style often seen with elite pool swimmers.  Additional idiosyncrasies that differ between triathletes and swimmers include the following:

  • Flip turns: The most efficient way to change direction once one hits the wall, the flip-turn is a major status symbol at any pool, separating the real swimmers from the mere mortals.  Because of the lack of need to execute this in open-water races, many age group triathletes have yet to learn this dark and mysterious art. 
  • Garmin: Given that triathletes are mentally challenged and overly reliant on fancy gadgets, they are forced to rely on these devices to measure out their splits, hitting the lap button after every rep to the frustration of lane-mates and swim coaches.  By contrast, dedicated swimmers have had internal metronomes installed in their brains at birth and have mastered base-60 mathematics, allowing them to rely solely on the pool-side clock to measure out their splits. 

Cycling:

For the uninitiated, the world cycling community is governed by an ironclad and sacred set of laws known as “The Rules” set by governing body of MAMILs (middle aged men in lycra) known as the Velominati.  Below is a selection of highlights from this rulebook:

#9: If you are out riding in bad weather, it means you are a badass. Period.  Fair-weather riding is a luxury reserved for Sunday afternoons and wide boulevards. Those who ride in foul weather – be it cold, wet, or inordinately hot – are members of a special club of riders who, on the morning of a big ride, pull back the curtain to check the weather and, upon seeing rain falling from the skies, allow a wry smile to spread across their face. This is a rider who loves the work.

 #10: It never gets easier, you just go faster.  As this famous quote by Greg LeMan tells us, training, climbing, and racing is hard. It stays hard. To put it another way, per Greg Henderson: “Training is like fighting with a gorilla. You don’t stop when you’re tired. You stop when the gorilla is tired.”

#12: The correct number of bikes to own is n+1.  While the minimum number of bikes one should own is three, the correct number is n+1, where n is the number of bikes currently owned. This equation may also be re-written as s-1, where s is the number of bikes owned that would result in separation from your partner.

#25: The bikes on top of your car should be worth more than the car. Or at least be relatively more expensive.  Basically, if you’re putting your Huffy on your Rolls, you’re in trouble, mister.

#7: Tan lines should be cultivated and kept razor sharp.  Under no circumstances should one be rolling up their sleeves or shorts in an effort to somehow diminish one’s tan lines. Sleeveless jerseys are under no circumstances to be employed.

#20: There are only three remedies for pain. These are: (i) If your quads start to burn, shift forward to use your hamstrings and calves, or (ii) If your calves or hamstrings start to burn, shift back to use your quads, or (iii) if you feel wimpy and weak, meditate on Rule #5 and train more!

#5: Harden the f*ck up

Most pertinent to the discussion at hand:

#42: A bike race shall never be preceded with a swim and/or followed by a run.  If it’s preceded with a swim and/or followed by a run, it is not called a bike race, it is called duathlon or a triathlon. Neither of which is a bike race. Also keep in mind that one should only swim in order to prevent drowning, and should only run if being chased. And even then, one should only run fast enough to prevent capture.

In addition to our violation of the above, we triathletes are oftentimes shunned by the cycling community for the following reasons:

  • Socks: One’s sock game is a critical component of cycling culture, to the point that an entire section of the Velominati rulebook is dedicated to appropriate sock length and color combinations.  In 2019, professional cycling’s governing body, the UCI, threw its weight into the ring by setting regulations on sock length.  Due to our need to shave seconds off of the transition time between swimming and cycling, many triathletes choose to forgo wearing socks altogether, which is a major faux-pas in the eyes of the cycling community.  This is in fact perhaps one of the most surefire ways to spot a triathlete amongst a group of cyclists. 
  • Handling skills: Unlike in cycling where the race dynamics are dominated by large packs of closely spaced riders seeking to draft off of each other, longer-format triathlon races often require athletes to maintain a certain minimum distance during the bike leg.  As a result, triathletes will often spend a great deal of time training and racing alone, resulting in a not-unearned reputation of having subpar handling skills when riding in groups.  On the flip side of the coin, because we forced to constantly break through the wind ourselves, my observation has been that triathletes tend to be much better at pacing longer steady-state efforts.  As further consolation, a recent series of videos filmed by GCN indicates that a single rider on a triathlon bike can be faster than as many as 4 roadies working together in a paceline!
Road vs. Triathlon Bike

Running

Perhaps due in part to the lower barriers of entry equipment and facility-wise, the running community has cultivated a more open and inviting atmosphere for new athletes which has driven a massive increase in race participation over the past several decades but also leaves little for me to satirize vs. cycling (readers, please let me know if you have anything).  Nevertheless, with the rise of social media, one phenomenon that I’ve found has affected both runners and triathletes in particular is the following existential question: “if you run a marathon, and there is no one there to Instagram it, did you really run a marathon?”.  With the rise of Strava as the most common way to share one’s workouts with fellow athletes, the answer seems to be “if it is not recorded on Strava, it didn’t happen”. 

In terms of differentiating triathletes from dedicated runners, I noted previously how triathletes oftentimes shave their legs to reduce drag on both the swim and bike.  In addition, triathletes tend to carry more muscle mass in their upper bodies due to swimming which would only serve as deadweight for pure runners.

Racing

Given the distance involved, Ironman races are for the most part executed at an effort and pace that could be described as “conversational”.  For this reason, I’ve found these events to be unique in that they enable a great deal of entertaining on-course banter and smack-talk.  Some of my favorite personal anecdotes include:

  • After a notorious downhill section of the Lake Placid bike course known as the “Keene Descent”, where athletes can expect to hit speeds of 50-60mph, an older gentleman quipped that he was pretty sure that he had sod himself.
  • At an official electronic checkpoint on the furthest point of the Wisconsin bike course, a fellow athlete commented “yay, mommy knows I’m alive now!”
  • On the Wisconsin run course, I encountered a group of athletes who were singing the Game of Thrones theme song to pass the time.
  • On a particularly difficult climb on the Lake Placid bike course, an older lady verbally questioned my manhood as she passed me.  Those of my male readers who are looking to do their first Ironman: avoid my mistake and follow the wise advice I received the day prior from the race director when faced with this situation – “let her go!”

Such hijinks occur even at the mecca of our sport.  For example, Josh Amberger, a pro triathlete considered the best swimmer of the current generation, provided a colorful race report of his Kona experience:

While on the subject of racing, a question I am often asked is how athletes relieve themselves over the course of a race that can take the better part of a day.  While porta-potties are spaced periodically throughout the bike and run courses, for pros and serious age-groupers whose margin of victory can sometimes be measured in seconds, the simple answer is that they often do the deed while riding and running.  So the next time you are watching the live coverage of a race and see footage of someone generously pouring water on their lower body while riding / running, you now know exactly what is going on…

In my next post, we will explore the logistics of training during the winter.  In the meantime, for those of you who would like to follow my training progress, most of my sets can be found on my Strava account at: https://www.strava.com/athletes/15134014.

#dacakeisalie

Entry 10: Fueling the Furnace

In spite of its name, a strong argument can be made that the sport of triathlon is comprised not just of three disciplines but four – being as much an eating and drinking contest as it is a test of prowess in swimming, biking, and running.  In this post, we will explore how both race-day and everyday nutrition and hydration play a critical role in going the distance. 

Nutrition

As mentioned briefly on previous posts, endurance performance is powered by the consumption of two primary fuel sources: fat and carbohydrate.  As exercise intensity increases, one’s body must burn proportionally more carbohydrate given that it is much easier and faster to metabolize than fat.  The limiting factor here is that the human body can only store a finite amount of carbohydrate for immediate use, predominantly in the form of glycogen in both the bloodstream and the liver.  Once this supply of carbohydrate is exhausted, the body is forced to revert back to fat metabolism, resulting in a dramatic decrease in performance known colloquially as “bonking” or “hitting the wall”.  Additional symptoms of glycogen depletion include nausea, disorientation, tunnel-vision, heart palpitations, and of course: extreme “hangryness”.  Those of my readers who have experienced this phenomenon before would be quick to describe it as one of their least pleasant life experiences. 

Illustrative Fat vs. Carb Burning Contribution: Varies by Athlete


For this reason, periodically topping off carbohydrate stores is critical for sustaining one’s effort during both races and longer training sessions.  Before someone goes and wolfs down an entire birthday cake in the middle of a hard training session however, it should be noted that the human gut has an upper limit to the rate at which it can digest carbohydrates.  For a single carbohydrate (e.g. glucose), this is typically quoted at around 60-70 grams per hour.  If one consumes a variety of carbohydrates (e.g. glucose + fructose), this can be boosted to as much as 100 grams per hour.  It should be noted that achieving these absorption rate levels, particularly during exercise, does not happen overnight and requires extensive practice.

In addition to maintaining carbohydrate stores, an athlete can also extend the duration of his/her performance by increasing the overall proportion of fat as opposed to carb burned across all intensity levels through training.  Unlike carbohydrate, fat is for all intents and purposes an infinite resource for a one-day race unless one is chronically malnourished.  In my previous post, we took a deep dive into cellular respiration and the difference between slow-twitch and fast-twitch muscle fibers.  Because slow-twitch fibers are better adapted than fast-twitch fibers towards burning fat, shifting one’s muscle composition to the former can pay dividends in maintaining a specific intensity for longer periods of time and/or reducing one’s carbohydrate fueling requirements.  In this way, while most recreational athletes can maintain a moderate effort for 1.5-2 hours before hitting the wall, many professionals have achieved fat adaptation levels that allow them to extend this effort to over three hours.  As mentioned previously, ways of shifting one’s muscle composition in this manner include the following:

  • Medium intensity intervals (high tempo / low threshold zones, i.e. 88-94% of threshold)
  • Strength-endurance work (e.g. hill runs, low cadence rides)
  • Low-glycogen training (e.g. fasted rides/runs)

Hydration

In a similar manner to nutrition, hydration also plays a critical role in endurance performance.  Over the course of training and/or racing, the body sheds fluids through both sweat and respiration, which must be replaced in order to maintain a high level of intensity over an extended period of time.  While most of my readers would be familiar with the importance of water for both bodily and cell-level functions (water comprises ~60% of body mass), an oft-overlooked aspect of hydration is the maintenance of one’s balance of electrolytes (salts), which are also lost through one’s sweat.   Of the many types of salt that the body utilizes, sodium plays a particularly crucial role in the activation of nerve cells.  As such, simply drinking plain water to replace fluids over the course of a long bout of exercise can dilute the body’s sodium concentration levels, leading to a condition known as hyponatremia which in extreme cases can lead to a loss of consciousness and death. 

Hyponatremia Symptoms

The amount of fluids that one sheds over time varies significantly between athletes and is also subject to outside factors such as ambient temperature and humidity.  Typical exercise sweat rates can range between 0.5-2.5L per hour.  An easy way to measure one’s own sweat rate is by comparing one’s body weight before and after a workout, with every kg (2.2lbs) reduction corresponding to approximately 1L of water lost. 

Sweat Rate Distribution
Typical Sodium Loss Rates

The amount of sodium lost with this fluid can also vary significantly between athletes but is relatively constant across external conditions.  Typical values can range between 200-2,300mg/L of sweat lost.  Finding this value typically requires getting a sweat test at a nutritionist or fitness lab.

Sweat Test

Case Study: My Race Fueling Plan

With the basics established, we can now dive into the framework I used to develop my own nutrition and hydration plan for race day.  First, the parameters: the metabolic profile provided by my tests with Inscyd (explained in greater detail in my previous post), indicates that at target Ironman intensity, my body burns approximately 70-80g of carbohydrate per hour, while sweat tests indicate that I lose approximately 1L of sweat per hour and that each liter of sweat contains 1126mg of sodium. 

Insycd Metabolic Profile

Based on prior experience, I have found in that I am able to meet all these requirements with the products provided by aid stations placed in regular intervals throughout both the bike and run courses.  My hydration requirement is fulfilled by drinking slightly more than one Gatorade Endurance bottle (24oz, 710ml) every 45min.  At this rate, Gatorade Endurance also provides 30g of carbs and 827mg per hour.  On the bike, this is supplemented with 1 packet of Clif Bloks per hour, which provides an additional 46g of carbs and 300mg of sodium to hit my targets.  On the run, I have historically found it difficult to digest solid food (something learned the hard way at Ironman Lake Placid!), for which reason I instead ingest two packets of Gu Roctane gels per hour.  Because these gels do not provide quite enough sodium, I supplement this with a salt tab which I periodically lick to achieve the balance of that target. 

Race Day Nutrition Strategy

In terms of how this all works logistically, it goes without saying that it is extremely difficult to take in any form of hydration or nutrition during the swim.  For this reason, the bike portion of the race is particularly critical to making up that deficit and ensuring that one has sufficiently topped off the tank to complete the marathon.  As mentioned on a previous post, while many athletes elect to carry their own custom-tailored nutrition and hydration products (triathlon bikes are sometimes jokingly referred to as buffets on wheels), I have personally found that periodically replenishing one’s supplies at aid stations is much faster.  Not only does this save a great deal of weight (each bottle weighs half a kilo!) but it also allows me to maintain a cleaner, more aerodynamic bike frame.

Buffet on Wheels

During the run-portion of the race, most Ironman athletes generally take in both their hydration and nutrition at aid-stations. However, I have personally found this approach to be difficult as I am often unable to ingest a sufficient amount of fluids from the open cups served by said aid stations without coming to a complete stop. To solve this issue, over the past two seasons I have trained and raced with a hydration vest, which enables me to completely bypass aid stations. This proved to be a very successful strategy at Ironman Wisconsin last year, where I had the fastest run split of the day despite the extra weight. 

General Diet

While there have been a large number of diet trends that have arisen over the past few years (e.g.  intermittent fasting, keto, vertical, plant-based, paleo, etc.) and a wide variety of recommendations on the distribution of macros (protein, fats, and carbs), I have for better or for worse not followed any specific philosophy on this front.  Over the past few seasons, I have simply aimed to have balanced meals generally comprised of some form of meat, veggie, and carb-base, ideally from whole as opposed to processed food sources.  Aside from a substantially higher calorie count, the only major difference from a standard diet worth mentioning is with regard to the timing of meals.  While most of my readers would be familiar with the unpleasant “stitch” that develops when one exercises too soon after a major meal, between 1.5-2 hours following a meal, the body’s insulin level spikes to store glycogen in the liver, resulting in a temporary depletion in blood glycogen levels (in more colloquial terms, “food coma”).  For this reason, I have found that the most optimal time to exercise is after this two hour mark.  In addition, after a training session, the body’s ability to absorb nutrients remains substantially elevated for approximately 20-30 minutes, providing a window of opportunity to fast-track digestion and recovery ahead of one’s next session.

In my next post, we will take a break from the technical side of things and explore some of the more lighthearted and cultural elements of the sport of triathlon.  In the meantime, for those of you who would like to follow my training progress, most of my sets can be found on my Strava account at: https://www.strava.com/athletes/15134014.

#dacakeisalie

Entry 9: Training Plan Part 3, Addendum

After an extended hiatus, it is now time to get back in the saddle, both literally and figuratively.  As many of you may have heard, the Kona Ironman World Championship originally scheduled for October 2020 was postponed to February 2021 due to the extent of the COVID-19 pandemic.  Given the high likelihood that mass events will not take place until a vaccine is in circulation, I have instead elected to defer my qualification to the 2021 edition of the race being held next October.  While certainly a disappointing outcome, I do believe that this was the right call for the safety and wellbeing of participants, spectators, and kama’aina alike.  In addition, this postponement provides an incredible opportunity to experiment with new training protocols to potentially reach even greater heights of performance, which we will explore in detail in this post.   

Low Intensity Training – 80/20 Principle

Dr. Stephen Seiler

In studies conducted in the early 2000s, sports scientists like Stephen Seiler and Augusto Zapico found that on average, elite-level endurance athletes across a variety of sports (e.g. cross country skiing, rowing, swimming, cycling, and running) devoted a surprisingly large amount of time (~80% of sessions and ~90% of total hours) to low-intensity training, low intensity being defined as work executed below the first ventilatory threshold (“VT1”).  In laymen’s terms, this is often described as an intensity where one can easily hold a conversation or breathe through one’s nose.  Using the training zones described in a previous post, this would be roughly equivalent to Zone 2 and below.  The remaining 20% of sessions and/or 10% of hours was spent above VT1.  Dr. Seiler theorized that this “80/20” distribution has emerged amongst elite endurance athletes as the outcome of a natural selection-like process, i.e. in the 150 years since endurance sports took on their modern form, a large number of training intensity distributions have been tried and pitted against each other in high-stakes international competition, the inferior methods of which have been discarded.  

In contrast to the pros, surveys indicate that most recreational triathletes spend a much lower percentage of time (68% on average) at low intensity.  I myself have been guilty of this over the past few seasons, due to a combination of (i) a lack of discipline (let’s face it, no one likes to get passed by grandma on the road and zone 2 is embarrassingly slow) and (ii) the belief that the 80/20 distribution only applies to pro-level training volumes and that one can compensate a lack of training volume with increased intensity.  Nevertheless, controlled-randomized experiments such as that conducted by the University of Salzburg have found that athletes executing a training program most skewed towards the 80/20 benchmark had the greatest improvements in VO2max, time to exhaustion, peak cycling power, and peak running velocity over a nine-week period.  Furthermore, follow-up studies also suggest that these performance gains are scalable across a variety of training volume levels.  In terms of why this distribution seems to be the most efficient, it has been suggested that not only does a proportionally large amount of low-intensity training increase one’s muscle mitochondria count (the powerhouses of the cell), but also ensures that the athlete is fresh enough to execute higher intensity sessions with greater compliance and quality. 

Based on these findings and the additional time between now and Kona, I have taken the leap of faith to see whether the 80/20 distribution will lead to improved performance. For example, while my previous training plan called for 1 easy, 1 medium, and two hard rides per week, over the past few months, I have changed this to 3 easy rides and 1 hard ride per week.  While initial performance improvements have been promising (e.g. FTP has risen from a trough of 280 watts after taking some time off to 291 watts, greater than my pre-Wisconsin peak), time will tell whether effectively going slower in training will allow me to go faster on race-day. 

Medium vs. High Intensity Part 1: Underlying Science

Having established the need to ensure that 80% of training is executed at low intensity, the question then arises of how to distribute the remaining 20%.  To put it differently, is this time best spent at medium or high intensity or perhaps some combination of both?  Based on my read of the scientific literature to-date, the answer seems to be “it depends”.  Given the technical nature of this exploration, for this next section I have highlighted the key takeaways for my TLDR readers. 

As discussed in a previous post, one of the key limiting factors to endurance performance is one’s lactate threshold, i.e. the exercise intensity at which the body’s production of lactate overwhelms its ability to clear it, as illustrated in figure 1 below.  One may recall that an accumulation of lactate causes the unpleasant “burning sensation” that eventually forces the body to slow down.[1]

Figure 1: Lactate Threshold Drivers

A better understanding of this dynamic requires a quick throwback to high-school biology class. For the purposes of endurance sports, the human body is able to generate energy in two principal ways. 

Figure 2: Cell Respiration
  • Anaerobic Respiration: through a process known as glycolysis, cells break down glucose (sugar) molecules into pyruvate, resulting in a net gain of 2 ATP (the energy currency of the cell).  While this process is quick and does not require oxygen, the resulting pyruvate molecules are converted into lactate and shuttled into the bloodstream if they are not immediately used by the 2nd energy production method below.
  • Aerobic Respiration: utilizing either the pyruvate molecules generated by glycolysis above or the byproducts from the breakdown of fat, cells combine these with oxygen to produce 36 additional net ATP over multiple cycles.  Unlike anaerobic respiration which takes place in the cytoplasm (the gooey no-man’s land within the cell), aerobic respiration takes place within the mitochondria.   
Figure 3: Cell Diagram

The key takeaway here is that anaerobic respiration produces lactate while aerobic respiration clears lactate.  With this in mind, the human body has various kinds of muscle fibers that utilize these energy production methodologies in different proportions:

  • Type I: Also known as slow-twitch fibers, these muscle cells have a high concentration of mitochondria and therefore rely more on aerobic respiration.  These fibers are very good at producing low / moderate force contractions over long periods of time. 
  • Type IIx: More commonly known as fast-twitch fibers, these muscles have a lower concentration of mitochondria and therefore rely far more on anaerobic respiration.  These fibers are very good at producing high force contractions over short periods of time.  
  • Type IIa: These are intermediate type fibers that can be trained to be more akin to type I and type IIx fibers depending on external stimuli.

As such, an athlete’s lactate production for a given intensity level is strongly driven by his or her proportion of fast-twitch muscles.  The more fast twitch muscles, the more lactate one tends to produce. While the most accurate way to measure this proportion is via a muscle biopsy, one can also measure Vlamax (maximum production rate of lactate) via a maximal sprint test as a proxy. 

Although lactate production is driven by the proportion of fast-twitch fibers, the corresponding proportion of slow-twitch muscles does not necessarily determine one’s lactate clearance rate, as aerobic respiration is more constrained by the body’s ability to deliver oxygen to individual muscles cells.  This is driven by factors such as lung capacity, the efficiency of gas exchange at the lungs, the stroke volume of one’s heart, red blood cell count, and muscle capillarization.  Conveniently, all of these factors can be summarized by a single variable, Vo2max, which measures the maximum amount of oxygen that one can utilize during intense exercise as described in a previous post

To summarize what we’ve gone over so far, lactate production is determined by one’s proportion of fast-twitch muscle fibers (measured by Vlamax), while lactate clearance is determined by one’s aerobic capacity (measured by VO2Max).  The exercise intensity where these two lines intersect, at which point lactate starts to accumulate and forces the athlete to slow down, is known as the lactate threshold.  All this has been summarized in figure 6 below.    

Figure 6: Lactate Threshold Drivers (Expanded)

Using this framework, one can see that there are two possible ways to increase one’s lactate threshold:  (i) by increasing one’s aerobic capacity (increase Vo2Max, figure 7) or (ii) by decreasing one’s proportion of fast-twitch fibers (decrease Vlamax, figure 8)

Having addressed the underlying science, we can now examine what training protocols can be used to accomplish these ends. 

Raising one’s Vo2max can be accomplished with the following training protocols:

  • High training volume at low intensity (already accomplished by 80/20 distribution rule)
  • High-intensity intervals (threshold and Vo2max zones, i.e. 100%-120% of threshold)

Lowering one’s Vlamax can be accomplished with the following training protocols:

  • Medium intensity intervals (high tempo / low threshold zones, i.e. 88-94% of threshold)
  • Strength-endurance work (e.g. hill runs, low cadence rides)
  • Low-glycogen training (e.g. fasted rides)

It should be noted however, that maintaining a high Vlamax may be desirable for certain race formats such as draft legal triathlons, road races, and other applications that require frequent anaerobic surges to bridge gaps and chase down breakaways.  For these athletes, the only viable path to increasing anaerobic threshold is raising Vo2max. 

Medium vs. High Intensity Part 2: Personal Case Study

Returning to the original question of how an athlete should distribute the remaining 20% of his or her training time, the answer is dependent on the amount of “room” one has to improve in each metric.  Using myself as a case study, a recent battery of fitness tests I executed on the Inscyd platform measured my cycling Vo2max at 67.4ml/min/kg and Vlamax at 0.52mmol/l/s.

Figure 9: Inscyd Results

Based on the rule of thumb that one’s cycling Vo2max is often marginally lower than one’s running Vo2max and the fact that my running Vo2max has consistently been tested at around 70ml/min/kg in the past suggests that my Vo2max is close to maxed out.  By comparison, my Vlamax is materially higher than what would be considered optimal for a long-course triathlete (typically in the 0.30 range), suggesting significant room for improvement via the conversion of fast twitch to slow twitch fibers.   This comes as no surprise given my collegiate squash background, which involved a significant amount of anaerobic microintervals.  The Inscyd test results thus suggest that the remaining 20% of my time should be spent doing medium intensity intervals, strength endurance work, and fasted training.  Using the below contour chart reverse-engineered from Inscyd’s model, a reduction in Vlamax from 0.52 to 0.30 could potentially result in a threshold increase from 290 watts to ~330 watts, a nearly 14% improvement. 

Figure 10: Contour Plot (X Axis: Vo2Max, Y Axis: Vlamax, Z Axis: Lactate Threshold)

It should be noted that the hypotheses that I have drawn in this post are merely based upon my personal collation of the latest research in sports science. Not only may my interpretation of this body of knowledge be incorrect (and I readily invite my readers to correct any errors I have made), but like all science, our understanding of the human body is itself subject to constant change and refinement. Nevertheless, the extra time between now and Kona provide a unique opportunity to see whether these theories work in practice, and I will certainly be sure to keep my readers informed on my progress in this journey.

In my next post, we will explore the importance of daily and race-day nutrition on performance.  In the meantime, for those of you who would like to follow my training progress, most of my sets can be found on my Strava account at: https://www.strava.com/athletes/15134014.

#dacakeisalie


[1] For the more scientifically minded amongst my readers, technically the burning sensation is caused by blood acidification as a result of excess hydrogen ions but this has been found to be directly proportional to lactate, which is used as a proxy.

Entry 8: Equipment Part 2, Race Gear

Alternative Race Rig: Fat Bike

Having covered in last month’s post the tools used to measure and manage the training process, we will now explore the equipment I have selected to use for race-day.  It should be noted up front that while triathlon may seem to be place a heavy emphasis on fancy bikes and cool gadgets, none of these things are necessary to participate in and, more importantly, enjoy the sport.  For example, many popular events (such as the Olympic distance races in New York and Chicago) maintain racing divisions specifically for athletes using fun alternatives such as Citi-bikes.  Similarly, when racing at Ironman Wisconsin last year, I ran into a gentleman who had undertaken the challenge of riding all 112 miles on a fat-bike (I challenge my readers to beat his highly respectable overall time of 11 hours!). 

It goes without saying that one’s training and preparation are by far the most important determinants of performance on race day.  That being said, once this has been reasonably optimized, smart equipment choices can provide marginal gains that become increasingly more important as one aspires to the pointy-end of the field, where a podium spot or Kona-qualification may be the difference of seconds (as was the case for me at Wisconsin last year).

Cross-Discipline

Tri-Suit: While one can most certainly complete a triathlon in a swimsuit, cycling kit, and/or an ordinary tee and shorts, many athletes opt for a dedicated suit that can be worn across all three disciplines. These so-called “tri” suits confer a number of advantages:

  • Transitions: Given the lack of need to change into a new set of clothes, athletes can materially reduce the time it takes to transition from swim to bike and bike to run.
  • Comfort: Via seam placement and the strategic use of materials, a well-made tri-suit is generally designed to maximize athlete comfort over a long race (from personal experience, chafage becomes a very real issue after 9+ hours on the course!) Like cycling shorts, tri-suits often include a chamois pad to protect one’s nether regions when on the bike. Unlike cycling shorts however, this chamois pad is often smaller and specifically designed to dry out faster after the swim leg and be less of a nuisance when running.
  • Speed: Often made out of spandex-derived materials, tri-suits are designed to closely hug the body, substantially reducing both hydrodynamic and aerodynamic drag. In the context of the bike-leg, the general rule of thumb is that switching from a standard club-fit cycling jersey to a well-fitted tri-suit can provide a drag savings of 10-15 watts, which equates to approximately 4-5 minutes over the course of an Ironman bike-leg (or in my case, the equivalent of over three months-worth of training!)

For this season, I have chosen to use Endura’s QDC Drag2Zero SST tri-suit. While there is a great variety of manufacturers out there (in the past I’ve used clothing made by Castelli, Roka, and Assos), this particular design received the dubious distinction of being banned by the UCI, pro-cycling’s governing body, who declared that its use of woven chevrons to improve laminar flow on the shoulder area was too fast.  Triathlon operates under a separate and distinctly more relaxed rulebook when it comes to equipment, and many pros have used this suit to great success over the past couple of years. In order to better deal with the heat and humidity likely to be encountered in Kona, I have chosen a mostly white design.

Endura QDC Drag2Zero SST Tri-Suit

Swim

Roka Viper X Swimskin

Swimskin: Given that the swim leg of most triathlons takes place in open bodies of water such as lakes or oceans, many athletes often opt to wear a wetsuit. Most commonly made out of neoprene, wetsuits provide insulation and can also allow athletes to swim faster by facilitating a more streamlined position and providing additional buoyancy. For the average swimmer, most coaches peg the time savings of a wetsuit at around 10 seconds per 100m, or approximately 5-6 minutes over the course of an Ironman swim. Wetsuits are usually prohibited at Kona given the warm water temperatures, for which reason many athletes opt to wear swimskins, which are made out of fabric as opposed to neoprene.  The time savings of a swimskin are more modest, around 5 seconds per 100m, or 2-3 minutes over the course of an Ironman swim. For Kona, I’ve chosen to use the Roka Viper X swimskin in a sleeveless configuration for maximum arm mobility.  Alternative makers include BlueSeventy, Huub, TYR, Orca, amongst others. 

Bike

Although progress in cycling equipment has historically been driven by the development of stiffer and lighter weight materials (e.g. titanium alloys and carbon fiber layups), the focus has markedly shifted in recent decades towards improved aerodynamics. This is due to the recent realization that even at modest speeds (for most riders, above 10-12 mph), the force of aerodynamic drag becomes the predominant limiter to performance (over other factors such as weight and rolling resistance), given that it increases exponentially with one’s speed as per the equation below:

Here, FD represents the force of drag, ρ represents the mass density of a fluid, v represents velocity, CD represents drag coefficient (shape dependent) and A represents the area presented to the wind.

The type of bike that one uses in triathlon depends on the format of the race.  For example, at the Olympics and many shorter races where drafting is permitted (i.e. athletes are allowed to ride closely behind each other in packs in order to shelter from the wind and tactically reduce their energy expenditure), participants are required to use traditional road bikes.  In non-draft legal races such as an Ironman where athletes are required to maintain a minimum distance between each other, the use of time-trial (“TT”) bikes is permitted. TT bikes differ from standard road bikes in that they possess two sets of handlebars: a wider set known as “bullhorns” which house the brake levers, and a narrower set known as “aerobars” which allow the rider to rest his arms on a set of elbow pads in a much lower, tucked position.  While a TT bike allows for a far more aerodynamic position, given that the brakes levers are not immediately accessible, race organizers do not permit their use in draft-legal racing for safety reasons.  Within the category of TT bikes, it should be noted that one can easily retrofit a standard road bike with aerobars, although purpose-built TT frames are generally slightly faster for a given rider position.  Dedicated triathlon bikes are distinct in that they often incorporate features that are not legal in traditional bike races sanctioned by the UCI, such as deeper frame shapes and integrated hydration / storage.  

Road Bike vs. TT Bike
Bike Fit Process

Bike Fit: Most coaches and manufacturers would agree that as much as 80% of aerodynamic drag comes from the rider (as opposed to his/her bike) which is driven by one’s riding position and clothing (see my commentary on tri-suits above). However, adopting a more aggressive aero tuck on the saddle must be balanced against one’s ability to (i) produce power in that position and (ii) sustain that position for long periods of time. In order to optimize between these considerations, a strong case can be made that ahead of any specific equipment choices, a properly executed bike fit is one of the best returns on investment from a performance perspective. While there is significant variation between individuals, the drag savings from a change from a standard road bike position to a well-optimized TT position has been known to be as high as 60-80 watts (20 minutes over an Ironman). During a bike fit, a technician assesses a rider’s anatomic dimensions, flexibility, and strength to adjust the key contact points on an existing bike or to make recommendations on the specifications of a new frame. These specifications include but are not limited to saddle height and fore/aft position, handlebar stack/reach, crank length, pedal width, and cleat position. 

While on this subject, I would like to make a special callout to Julie, Lori, Juan, and Kevin at Pacific SBR in Stamford, Connecticut, who all played an instrumental role in developing, building, and maintaining the rig that ultimately helped snag my Kona qualification at Ironman Wisconsin last year. It is difficult to give this dream team enough praise for their attention to detail and customer service, for which reason it will be an honor to wear their logo on race day as a small way to give back.

Felt IA FRD

Bike Frame: Based on the specifications obtained from my bike fit with Lori at Pacific SBR, we ultimately decided to build a rig based on the Felt IA FRD triathlon frame in size 48, the smallest size available. Despite being 5’ 10”, this was one of the few frames that can actually accommodate my dimensions given my proportionally short legs and long torso (hence the name of this blog, “Kona Korgi”).  This was also one of the few triathlon bike frames at the time to accommodate hydraulic disc brakes, which are considered to be more reliable across various weather conditions vs. rim brakes.  It certainly does not hurt that this frame has been ridden to victory at Kona for six years in a row under Daniela Ryf and Mirinda Carfrae. 

SRAM ETAP RED AXS

Drivetrain: In terms of drivetrain, we installed SRAM’s ETAP RED AXS groupset, an electronic system which requires very little maintenance and provides the greatest optionality in terms of gear shifter placement (vs. mechanical systems which are cable-actuated and only allow riders to shift from the aerobars).  At the time of purchase, this was also the only 12-speed groupset available on the market (vs. the current 11-speed standard), which allowed the installation of a wider set of gear ratios without the gaps between gears being too large.  In terms of actual gearing, I chose to run a 48/35 chainring up front with 10-33 cassette in the back. While some may consider these to be “granny gears”, this choice was deliberate to ensure that I could climb the steepest grades in Wisconsin (10%+) without exceeding my threshold power.   Although the climbs in Kona are not as steep, when combined with a potential 60+ mph head wind, I firmly believe that this gear combination remains a prudent choice.  This drivetrain was further optimized via the installation of ceramic bearings and oversized pulley wheels, which together save approximately 5 watts (1-2 minutes over an Ironman / 1 month of training).  Two additional notes on this topic are that I run very short 165mm cranks on account of my short legs and have a Quarq power meter integrated into the chainring.  In terms of alternatives, the groupset space is dominated by Shimano, SRAM, and Campagnolo. 

Chain Waxing Process

Sidenote on Drivetrain Maintenance: Perhaps one of the easiest and cheapest ways to obtain additional speed for a given amount of energy output on the bike is a properly maintained drivetrain.  Over the course of multiple rides, the accumulation of grit and grime creates additional drag in one’s chain, resulting in mechanical losses.  While most cyclists address this via the removal and reapplication of oil-based lubricant, studies have shown that immersing one’s chain in paraffin wax can provide a 5-watt saving (1-2 minutes over an Ironman / 1 month of training) over conventional methods.  Paraffin wax has also been shown to last significantly longer (200-300 miles vs. a single ride for most oil-based lubricants), the only real downside being the time, mess, and hassle of the application process. 

ISM PS 1.1

Saddle: One the bike’s primary contact points, saddles come in a wide variety of shapes and sizes and a rider’s ultimate choice of saddle is a highly personal one that oftentimes requires a substantial amount of trial and error (to put it bluntly, everyone’s undercarriage is shaped differently!).  I for one have gone through at least six different designs over the past 3 seasons before settling on my current choice, the ISM PS 1.1.  This is a split nose design which shifts the rider’s weight from soft tissue to sit-bones, enabling the rider to rotate the hips forward into a more aerodynamic position.  Other saddle manufacturers that typically have a strong showing at Kona included Cobb, Fizik, Specialized, Bontrager, ProLogo, and Selle Italia.

Aerobars: While most TT frames come with their own stock set of aerobars, I instead opted to install an aftermarket set of Profile Design Aeria Ultimate bars coupled with TriRig’s Scoop armpads.  This combination enables the rider to cant the aerobars upward at a 15 degree angle in a so-called “praying mantis” position.  I’ve found this setup to be far more comfortable and secure in bumpy and windy conditions, enabling me to maintain the aero position for longer periods of time. 

Speedplay Zero Aero

Pedals: For pedals, I’ve opted to run Speedplay’s Zero Aero model, which are unique in that they sit flush with one’s cycling shoes and utilize a dimpled surface design to improve laminar flow.  3rd party testing has indicated that these pedals provide a 4-6 watt savings in aerodynamic drag over standard designs (1-2 minutes over an Ironman / 1 month of training).  Other common pedal manufacturers include Shimano, Look, and Time.

Wheels: By reducing the turbulence created by rotating spokes, deeper section wheels can provide significant aerodynamic gains on the order of 20-30 watts over standard box-section rims (7-8 minutes over an Ironman / 5-6 months of training).  In addition to being very expensive, the tradeoff of deep section wheels is that they tend to be heavier and more sensitive to crosswinds, which can force riders out of the aero position.  While the fastest possible wheel setup is to run a solid disc wheel (as I did at Wisconsin), their use is prohibited in Kona for safety reasons due to the potential for 60+ mph crosswinds on the course.  As such, I have elected to run with Enve’s SES 7.8 wheels for race day.  In addition to being very deep (70mm up front and 80mm in the back), these wheels utilize a toroidal shape that is more resistant to sudden pressure changes from crosswinds, which I have confirmed to be the case on past rides in Kona.  Other reputable wheel manufacturers include Zipp, Reynolds, and DT Swiss. 

Enve SES 7.8
Continental GP5000 TL

Tires: Similar to proper drivetrain maintenance, tire selection is amongst cheapest ways to obtain additional speed for a given amount of energy output on the bike.  Switching from a standard road tire to a race tire with lower rolling resistance can provide a 4-5 watts savings per wheel (3 minutes over an Ironman / 2 months of training).  While race tires tend to be more vulnerable to punctures, the recent rollout of tubeless tire designs which include liquid sealant have largely negated this disadvantage.  For Kona, I have elected to use Continental’s GP5000 tubeless tire in a 25mm size.  Other well-known tire manufacturers include Vittoria, Zipp, Michelin, and Schwalbe. 

Nutrition / Hydration: We will cover nutrition and hydration in much greater depth in a subsequent post, but it goes without saying that racing an Ironman requires a significant amount of fueling over the course of the day to sustain one’s performance.  To address this, the Felt IA FRD frame has a built-in “bento-box” on the top-tube that can store up to 6 packets of energy chews.  While most triathletes prefer to be self-sufficient and opt to carry a large number (4+) water bottles, I have personally found it faster to carry only one at a time (with another in reserve) and replenish these at aid stations.  Not only does this save a great deal of weight (each bottle weighs half a kilo!) but it also allows me to maintain a cleaner, more aerodynamic bike frame.  Indeed, both my water bottle cage positions (between the arms and behind the saddle) have been tested to have a negligible drag penalty.  In addition, I have found that bike aid stations are typically placed on slower sections of the course (e.g. at the foot of hills), minimizing any speed losses from the replenishment process. 

Giro Aerohead

Helmet: In addition to providing crash protection, wearing a specifically designed TT helmet can also significantly reduce aerodynamic drag on the order of 10-12 watts (3 minutes over an Ironman / 2-3 months of training).  The tradeoff here is that TT helmets generally have poorer ventilation vs. standard road helmets which can become an issue at hot races such as Kona.  I have used the Giro Aerohead helmet over the past three seasons and the only change that I have made for Kona is to switch to a white color to better cope with the heat and humidity.  This particular helmet is unique in that it has a wraparound visor that provides excellent peripheral vision, in addition to looking rather intimidating. 

Shoes: Like saddles, shoes are a highly personal choice on account of style and anatomical differences between riders.  For Kona, I have chosen to use Shimano’s RC-9 Sphyre shoes, which I’ve personally found to strike a good balance between stiffness and comfort.  Like other items that I am wearing for Kona, I have chosen a white color to best cope with the heat and humidity.  Other well-known brands include Fizik, Bont, Giro, Specialized, and many more. 

Shimano Sphyre

Socks: While many triathletes opt to forego socks on the bike in order to save time in transition, I have personally found taking the extra time goes a long way in making the 112 mile bike ride more bearable.  Studies over the past year have also shown that certain fabrics and weaves are actually more aerodynamic than bare skin.  For this reason, I have opted to use Defeet Disruptors, which are claimed to save 4-5 watts (1-2 minutes over an Ironman / 1 month of training). 

Defeet Disruptor

Complete Bike: The below picture shows my full bike race rig as set up for Ironman Wisconsin.  Changes since then include my tri-suit, helmet, shoes, and rear wheel. 

IM Wisconsin Setup

It goes without saying that chasing marginal gains when it comes to bike equipment can quickly become very expensive.  In order that others may not make the same mistakes that I have in this journey, below I have created a list which orders the various equipment choices available from highest to lowest return on investment based on my personal experience. 

  1. Bike Fit
  2. Waxed chain
  3. Tires
  4. Clothing
  5. Helmet
  6. Wheels
  7. Pedals
  8. TT-specific frame
  9. Optimized drivetrain (e.g. ceramic bearings)

Run

Nike Zoom Pegasus Turbo (Gen 1)

Shoes: Over the past few months, a great deal of controversy has arisen around the legality of Nike’s Vaporfly 4% / Next% running shoes. Integrating a carbon-fiber plate in the sole, these shoes have proven to be materially faster than their competition in tests, allowing runners to increase their pace by 4-5% for the same energy expenditure. While the potential marginal gains of these shoes have been firmly established, I have chosen not to wear them for Kona for two personal reasons: First, I have not found the thin uppers of the recent generation of Nike racing shoes to be particularly comfortable nor easy to put on rapidly in the transition between bike and run, offsetting some of the potential time-savings.  In addition, the insoles of these shoes are fully integrated into the design, preventing the use of third-party orthotics, without which my time using these shoes has been plagued with overuse injuries. For these reasons, I have instead opted to use the 1st generation Nike Zoom Pegasus Turbo, which I have used successfully at all my previous races.

Salomon ADV Skin 5 Set

Hydration Vest: During the run-portion of the race, most Ironman athletes generally take in both their hydration and nutrition at aid-stations placed every 1-2 miles on the course. However, I have personally found this approach to be difficult as I am often unable ingest a sufficient amount of fluids from the open cups served by said aid stations without coming to a complete stop. To solve this issue, over the past two seasons I have trained and raced with a hydration vest, which enables me to completely bypass aid stations. This proved to be a very successful strategy at Ironman Wisconsin last year, where I had the fastest run split of the day despite the extra weight.  The particular model that I use is the Salomon ADV Skin 5 Set, which provides up to 3L of liquid capacity (more than enough for a marathon), although there are plenty of options out there by companies such as CamelBak and Osprey. 

In my next post, we will explore a few additional training concepts that I feel were not adequately addressed in my previous posts.  In the meantime, for those of you who would like to follow my training progress, most of my sets can be found on my Strava account at: https://www.strava.com/athletes/15134014.

#dacakeisalie

Entry 7: Equipment Part 1, Training Tools

A Quick Note on COVID19:

Before diving into the main topic of this month’s post, would first like to express my hope that all my readers and their families are safe and healthy through this uncertain time.  The COVID19 virus and recent measures to mitigate its spread have no doubt caused great disruption to everyone’s daily lives, posing a particularly serious existential threat to the elderly as well as people with pre-existing conditions, operating small businesses, and working in the service industry.  I leave it to my readers to determine what specific course of action they believe to be most effective, but I hope that we as a community can see this as an opportunity to reach out and assist our neighbors most vulnerable to the situation at hand. 

While the issues faced by amateur athletes pale in comparison to those mentioned above, the past few weeks have nevertheless provided a sobering reminder on the importance of distinguishing those things which are and are not in our control.  Many of us have been compelled to recalibrate our goals and expectations due to cancelled events and improvise workarounds as gym facilities, pools, and public spaces have shut down and quarantine measures have been put into effect.  As for myself, the recent cancellation of high-profile events such as the 2020 Olympics have put into doubt whether the 2020 Kona Ironman World Championship will go ahead this coming October.  I nevertheless continue to forge ahead with training so that I may meet the challenge should it still be available to me in 28 weeks.  Although a cancellation would most certainly be disappointing, I do not believe that this preparation would be a wasted effort.  For one, there are number of challenges and events (the details of which I will provide should a cancellation occur) for which I can certainly leverage the fitness gained.  At a very minimum, in-line with what I have experienced over the past three seasons, the training process supplies a structure and daily routine that provide a solid grounding during uncertain times such as these. 

Introduction to Training Equipment

Over the next few posts, we will take a detailed look into the equipment I use for both training and racing.  For what it is worth, it should be noted up-front that I am not sponsored, and like many other aspects of this journey, my equipment choices have been subject to a great deal of trial and error.  As a sample size of one, I can by no means claim that the tools that I highlight are the best available, but simply those that have worked for me.  Where possible, I will try to point out alternatives that I am aware of.  These caveats aside, I will nevertheless venture to make a few special callouts to both products and people that have had an outsized impact on road to Kona.  While triathlon is an individual sport, excelling in it is very much a team effort, and I would like to use this medium as a way to thank those who have made this journey possible. 

Those of my readers who are currently in or have completed business school will no doubt be familiar with Peter Drucker’s adage: “you can’t manage what you can’t measure”.  In this post, we will explore the tools that I use to track the metrics we have explored in previous posts, which are then used to inform and optimize my training load. 

General Training Management

  • TrainingPeaks: As I have alluded to in several previous posts, over the past few years, I have extensively used TrainingPeaks as my hub for training data collection and analysis. TrainingPeaks is a cloud-based software platform which provides several features that I have found incredibly useful:
    1. Calendar: This feature enables both coaches and athletes to schedule and upload workouts, enabling more precise season planning and enforcing greater training compliance. 
    2. Workout Analysis: This feature enables both coaches and athletes to get very deep in the weeds on the metrics recorded for each individual workout, allowing them to assess whether key benchmarks have been met and the goals of the workout have been achieved. undefined
    3. Performance Management Chart (“PMC”): As outlined in post #5, by collecting the cumulative data of all training sessions, TrainingPeaks is able to calculate one’s training stress score (“TSS”), chronic training load (“CTL”, or fitness), acute training load (“ATL” or fatigue), and training stress balance (“TSB” or form).  Taken together, these metrics are incredibly useful for tracking the progress of one’s training and knowing when it is appropriate to back off the overall load via rest days and/or recovery weeks. undefined

While TrainingPeaks is the software most commonly used by triathletes, viable alternatives in the market with similar feature sets include Golden Cheetah, Xert, and Today’s Plan.

  • Fitness Watch / Tracker: Arguably a triathlete’s best friend, a fitness watch enables athletes to record relevant data across all three sports via either the watch itself or connections to third-party devices.  This can then be displayed to the athlete in real-time for in-workout and race-day decision-making and saved down for later analysis through software such as TrainingPeaks.  The data recorded depends on the sport, a sample of which is provided below:
    1. Swimming: split times, heart rate, stroke rate
    2. Cycling: power, cadence, heart rate, speed
    3. Running: speed, heart rate, cadence

In addition to workout data, if worn throughout the day, fitness watches are also useful for tracking general health metrics like resting heart rate, heart rate variability, sleep quantity and quality, SPO2, etc.  The most common devices used by triathletes are produced by Garmin, Polar, and Suunto.  I have personally used the Garmin Fenix 5S (an older model) for the past 2 seasons. 

Garmin Fenix 5S

Swim Tools

Of the three sports, swimming remains perhaps the least affected by recent advances in fitness technology when it comes to everyday training.  Indeed, most competent swimmers rely solely on the most analog of devices to keep track of their split times: the pool-side clock.  That being said, fitness watches (see above) can supplement this by recording split times as well as additional data fields such as stroke and heart rate for later analysis.  However, one can generally only view these metrics at the end of each set given the difficulty of checking one’s watch underwater.  While HUD-based devices are currently being tested and rolled out, such products have not yet reached full maturity. 

SwimLabs Facility
  • SwimLabs: Given the technical nature of swimming, perhaps the biggest gamechanger to my swim performance over the past season has been the decision to work on my stroke with SwimLabs.  SwimLabs maintains an extensive network of coaches and locations throughout the US that provide technical instruction informed by 360-degree video analysis and software that allows side-by-side comparison against world-class professionals as well personal technique changes over time.  All this takes place in endless pools (think swim treadmills) with mirrors placed at multiple angles to allow swimmers to better understand prescribed changes to their stroke.  While many coaches do offer video stroke analysis, SwimLabs is the only setup that I am aware of that allows for on-the-spot, real-time feedback, which greatly reduces the trial-and-error process of traditional coaching.  I would like to provide a special call-out to Coach Joe Eiden at the Westchester, New York location, whose guidance has been instrumental in knocking off 10 seconds from my 100 yard swim time over the course of 3 months (nearly 7 minutes over the course of an Ironman!). 
  • Swim Smooth: Whether it be prescribed directly by a coach, one’s local masters swim squad, or one of the many online platforms, there exists a wide variety of swim training plans geared toward triathletes.  Having tried multiple other curricula over the past few years, I recently made the switch to Paul Newsome’s Swim Smooth online program for this season.  The reasons for this switch were the program’s ability to dynamically adjust one’s drills and sets based on technical faults identified by my work with SwimLabs, as well as its extensive library of video instruction on the execution of and the purpose behind said drills. 

Bike Tools

  • Power Meter: A strong case can be made that power meters have fundamentally changed the sport of cycling over the past few decades.  Through the use of strain gauges, a power meter enables riders to measure their effective energy output, which unlike other metrics such as heart rate or speed, is unaffected by extraneous factors such as heat, humidity, altitude, terrain, sickness, etc.  This in turn has allowed both coaches and riders to more precisely calibrate training sessions to target specific training zones (see post #4) as well as gauge their pacing during races.  Power meters can take a wide variety of forms depending on their placement on a bike’s drivetrain, including but not limited to the pedals, crank arms, chainring spider, and wheel hub.  I personally use Quarq’s DZero power meter, which is integrated into the chainring spider and well known for its reliability and light weight. 
  • Head Unit: While some triathletes utilize their watch to display their cycling data, many choose to have this data displayed on a dedicated bike computer attached to their handlebars due to the greater safety it provides by being in the rider’s direct line-of-sight.  Higher-end units also have additional features such as maps, GPS guidance, as well as automatic SOS in the unfortunate event of a crash.  The two heavyweights in this space are Garmin and Wahoo, and I have been using a Garmin Edge 830 for the past two seasons. 
Garmin Edge 830 Head Unit
  • TrainerRoad: As mentioned with swimming, whether prescribed directly by a coach or one of the many online platforms, there exists a litany of cycling training plans available for triathletes to follow.  While primarily geared as a training platform for cyclists, TrainerRoad has served as the foundation of my overall Ironman training strategy for the past two seasons.  In addition to providing an extensive library of swim, bike, and run workouts and training plans, TrainerRoad also maintains a strong written and podcast content base that educates its users on the fundamentals and scientific principles of its training approach.  Indeed, a great amount of the knowledge that I have shared on this blog was in some degree learned from TrainerRoad or one of the many empirical studies it directed me towards.  I would like to make a special callout to coach Chad, Jonathan, and Nate and the TrainerRoad team by stating that it is no exaggeration that my subscription to TrainerRoad may be the greatest return on money and effort spent from a performance gain perspective in the sport, having increased my functional threshold power from a baseline of 260 watts two years ago to 296 watts today (a 14% increase to-date and still rising!). 
  • Zwift: Traditionally seen as a winter-specific activity, indoor bike training has taken on a newfound importance in recent months given the current climate of mandated quarantines and calls for social-distancing in the fight against COVID19.   To combat the boredom normally associated with pedaling in place, over the past few seasons, I have extensively utilized Zwift, which is a computer program that provides a variety of immersive virtual courses where cyclists can train.  Zwift also has a number of social features which enable athletes to organize group rides with their friends as well as races with fellow competitors worldwide.  As of March 2019, Zwift has over 1 million subscribers around the world. 

To incentivize greater participation, Zwift has also “gamified” the training experience by setting up a virtual currency within the platform which users can earn through the accumulation of mileage and unlocking various achievements (e.g. winning races).  This currency can then be used to purchase virtual gear and outfits.  I am personally proud to say that after logging over 10,000 miles on Zwift, I have finally unlocked the exact bike setup that I intend to use at Kona (more on this in a subsequent post). 

It should be noted that Zwift is not the only virtual cycling platform.  Other products available in the market include TheSufferFest, Rouvy, BKool, and FulGaz.  

  • Indoor Bike Trainer: In order to participate on virtual courses such as those provided by Zwift, one generally needs to use an indoor bike trainer, which either comes as a standalone unit or a bolt-on to one’s outdoor bike setup.  Higher-end “smart” trainers are able to add additional immersive elements such as grade changes (e.g. climbing a 10% grade hill in Zwift results in the trainer automatically adding resistance) or road surface simulation.  There are a large number of products available on the market, but I personally use the Tacx Neo 2 given its power accuracy and lack of need to calibrate before and after every ride. 
Tacx Neo 2 Smart Trainer
  • BestBikeSplit: Over the past 2 seasons, I have used BestBikeSplit to help formulate my race-day pacing strategy.  BestBikeSplit’s online algorithm combines GPS, topological, and historical weather data, along with athlete inputs such as one’s functional threshold power, drag coefficient, and total bike setup weight to yield an optimized power target over various sections of a course.  I have used this tool to great success at both Ironman Lake Placid and Wisconsin, at which my race-day bike splits were within 5 minutes of what BestBikeSplit predicted. 

Run Tools

Compared to all other sports, running is elegant in its simplicity, requiring no special equipment or facilities for people to participate (run minimalists would argue that even sneakers are optional!).  That being said, fitness watches (see above) can greatly enhance the quality of workouts by recording and displaying in real time metrics such as one’s speed, heart rate, and cadence, thus ensuring better compliance to what has been prescribed for the day.  However, I have sometimes found that the GPS data that fitness watches rely upon can sometimes be unreliable when running in the deep woods, near tall buildings, and in the presence of a large number of mobile devices.  For this reason, I often use a footpod, which utilizes accelerometers to obtain more consistent speed and distance data and can also be used in indoor settings such as tracks and treadmills.  I personally use the Stryd pod, which also measures one’s running “power”, although the I do not utilize that feature as a scientific consensus has not been achieved on it.  Similar products are also produced by Garmin, Nike, and Polar. 

Stryd Foot Pod

In my next post, we will dive into the equipment that I plan to use on race day.  In the meantime, for those of you who would like to follow my training progress, most of my sets can be found on my Strava account at: https://www.strava.com/athletes/15134014.

#dacakeisalie

Entry 6: Rest and Recovery Part 2, Recovery Activities

In my previous post, we explored the importance of rest and recovery on endurance performance as well as various methods to measure fatigue and schedule one’s training sessions and mesocycles accordingly.   We will now take a more detailed look into potential practices that can help maximize the quality of one’s recovery between said training sessions. 

Those of you who have been active in sport at a competitive level will no doubt be familiar with the litany of recovery therapies and tools that have cropped up in recent years.  I have provided a sample of these implements below:

Compression Therapy: Claimed to reduce inflammation and fluid collection in the extremities while accelerating the removal of metabolic byproducts such as lactic acid.

Massages / Percussive Therapy: Claimed to break up scar tissue, release fascia, and increase blood and lymphatic flow, thus accelerating muscle repair. 

Ice Baths / Cryotherapy: Claimed to constrict blood vessels, flush waste products, and reduce inflammation as well as tissue breakdown.

E-Stim: Sends mild electrical pulses through the skin, causing the underlying nerves and muscles to “fire”.  Claimed to help stimulate injured muscles and improve muscle activation.

To date, large-sample controlled randomized studies conducted on these various therapies have either turned up inconclusive and/or contradictory to each other, and the position of many coaches has been that athletes should feel free to use them if they provide peace-of-mind / a psychological benefit.  However, one activity that lacks any controversy amongst both scientists and coaches is perhaps the simplest: sleep. 

In the context of endurance sports, sleep plays a critical role in the recovery process.  All forms of exercise, aerobic or otherwise, incur microtears in one’s muscles, the repair of which occurs most rapidly during sleep.  Per my previous post, the body’s natural ability to “supercompensate”, i.e. add additional muscle cells to areas where it has sustained damage, highlights how important sleep is to making strength and performance gains.  In addition, sleep accelerates the repletion of muscle and liver glycogen (readily available sugar stores, more on this in a subsequent post), normalizes hormone levels, and strengthens the body’s neural pathways to the specific muscle firing patterns one has been practicing in training. 

Sleep Quantity:

Sleep requirements can vary greatly between individuals and can be affected by factors such as training load and overall life stress, but most scientists and coaches generally recommend a minimum range of 7-9 hours per night on average.  Although high-level amateurs are sometimes able to reach training volumes comparable to that of professionals, professionals are able to reach higher levels of performance due to the greater amount of time they can spend getting quality sleep as opposed to balancing time commitments against a full-time job. 

In addition to hitting this range, it is also often recommended to time one’s waking time with one’s sleep cycle.  A single sleep cycle usually takes place over 90 minutes, during which time the body oscillates between light, rapid-eye-movement (“REM”) sleep and slow-wave “deep” sleep.  The latter is most commonly associated with the benefits stated above, and my readers will most likely be familiar with the groggy and disoriented sensation one experiences when deep sleep is interrupted.  It is for this reason that many doctors recommend nap times of either less than 15 minutes or greater than 90 minutes.  Ensuring that one wakes up during a lighter sleep phase can be accomplished by either maintaining a consistent sleep schedule or more conveniently, utilizing alarm applications that automatically detect one’s sleep phase.  Experiments have also indicated that one cannot “bank” on sleep, i.e. sleeping longer now in anticipation of future periods of sleep deprivation. 

From my personal training experience, I have found that getting 8 hours a night is ideal but have often been able to get by with as little as 7 hours in a pinch.  Anything below this and I have typically seen either a plateau or even a dip in performance on harder sessions. 

Quality Sleep

Sleep Quality

In recent years, scientists have studied ways to improve both the time it takes to fall asleep and propensity to stay asleep.  For example, minimizing exposure to blue light (e.g. reducing electronic device screen time and using blackout shades) prior to going to bed has been found to increase sleep-promoting melatonin levels.  In addition, maintaining a cooler core temperature and playing ambient noise to drown out potential disturbances have also been found to have positive effects.  Interestingly, while alcohol has been found to assist in falling asleep, it is also very disruptive to the REM phase of the sleep cycle, resulting in a greater propensity of waking up.  With the advent of wearables such as smart watches, numerous apps have been developed to monitor both the quantity and quality of one’s sleep and the potential impact on one’s ability to hit key sessions.   

Active Recovery / Injury Prevention

Expanding on the hypothesis we explored in a previous post that training consistency is one of the most important determinants of success in endurance sports, I have found that one of the keys to maintaining training consistency over the course of a season has been staying free from injury.  Over the course of my first two seasons as a newbie, I experienced the full gamut of injuries ranging from minor niggles to conditions taking months to recover from, including but not limited to: shin splints, plantar fasciitis, patellar / peroneal tendonitis, and lower back pain.  After a great deal of trial and error, I greatly attribute my breakout performance at Ironman Wisconsin to simply being able to keep such issues in check with by performing certain activities during the time between training sessions.  While the mileage of my readers may vary, below are a few of the lessons I learned through the process on avoiding major setbacks: 

  • Performance Management Chart: As outlined in my previous post, the Coggan PMC chart is an incredibly useful tool to ensuring that one does not increase training volume and/or intensity at a rate beyond the body’s ability to recover.  In my case, I have historically found that allowing my training stress balance value to drop below -40 tended to result in excessive fatigue as well as a greater propensity for injury. 
  • Warmups: Experiments have shown that warmup routines reduce the chances of injury by reducing the initial brittleness of muscle fibers via increased blood flow.  I have also found warmups helpful in that they provide sufficient time for my mind to brace for difficult sessions.  Every athlete has their own routine, but my warmups are typically comprised of 5-10 minutes of swimming / biking / running at a very easy pace combined with technique work and dynamic stretching (see below). 
  • Technique: It goes without saying that poor form can oftentimes lead to excessive strain to muscles and tendons that are not being used properly.  This is particularly the case for high impact sports such as running, where common mistakes such as over striding and heel-striking can significantly increase the forces absorbed by one’s ankles, knees and, hips.  For this reason, I’ve found that incorporating drills into my warmups (e.g. stride-work for running, cadence drills for cycling, and various pool toys for swimming) provides a good reminder of proper technique prior to executing the meat of one’s main set in training sessions.  As a personal anecdote, one particular muscle group that has given me trouble in the past has been my glutes, a direct result of my sedentary desk job.  If my glutes are not properly activated (which can take as long as 10-15 minutes!), this has oftentimes led to excessive strain to other muscles groups such as the hamstrings and calves, resulting in issues such as shin splints. 
  • Mobility: Because muscle and joint mobility is critical to the upkeep of said technique, over the years, I have come to allocate a material amount of time each day (~30 minutes) to static stretching and foam rolling.  Ensuring a sufficient range of motion not only ensures that individual fibers do not get unnecessarily strained, but can also provide potential performance gains (e.g. a more aerodynamic position on the bike and greater pull distance in the swim).  Typical muscle groups that I tend to target include the hip flexors, glutes, quads, hamstrings, calves, and lats, typically in intervals of over 2 minutes.  It should be noted that a distinction must be made between traditional static stretching (i.e. holding a muscle steady in a lengthened position for a certain amount of time) vs. dynamic stretching (e.g. leg swings).  Recent studies suggest that static stretching can increase risk of injury if performed prior to a workout. 
  • Strength Work: In a similar manner to technique, muscle weakness and imbalances in certain areas of the body can oftentimes result in other muscle groups overcompensating, which can in turn lead to overuse injuries.  To help their athletes avoid this issue, many coaches oftentimes establish certain minimum strength benchmarks.  Below are the benchmarks I have adhered to over the past few seasons as prescribed by Trainerroad (more on them on a subsequent post). 
Trainerroad Strength Benchmarks

To the cross-fitters and weightlifters amongst my readers, these requirements will likely seem to be laughably easy and perhaps even deserving of the #doyouevenlift Instagram handle.  The purpose of these sessions however is not to maximize strength but to maintain a minimum level of functionality in key muscle groups associated with swimming, biking, and running.  In addition, weightlifting is also generally known to develop fast-twitch as opposed to the slow twitch muscle fibers desirable for endurance sports, which in turn reduces energy efficiency and one’s sustainable power to weight ratio. 

  • Physical Pain: Before diving into this, I must issue the mandatory disclaimer that my readers should most certainly seek medical attention from a qualified doctor or physiotherapist if they experience training-related discomfort.  With that out of the way, I wish to share two high-level learnings from my own experience and many doctor visits over the past few years:
    • “Good” vs. “bad” pain: While all exercise causes bodily damage to some extent and pain is the body’s natural mechanism to protect itself from injury, one of my most important lessons from the past few seasons was learning to distinguish between pain that one can safely train through and pain that is indicative of long-term, chronic bodily damage.  As a general rule of thumb, I have found that the “burning” sensation that one experiences when working at intensities above threshold is the result of blood acidification as opposed to muscle damage and almost always disappears once one has spent sufficient time at a lower intensity for the body to return to equilibrium.  For pain that lasts longer than this, I have also found that one needs to make a distinction between pain that comes from the muscles vs. from one’s joints / tendons.  For the former, I have found that if the soreness does not last more than 2-3 days or tends to subside once one has warmed up, it is safe to train through.  Joint / tendon pain on the other hand is usually a major red flag, in which case I typically reassess whether there are any strength or mobility deficiencies in any of my movement patterns. 
    • Kinetic Chain: Another key lesson I’ve picked up along the way is that the cause of pain is oftentimes not the same as its source.  For example, I discovered that my multiple cases of plantar fasciitis (pain in the arch of the foot) were caused by excessive tightness in my calves.  Similarly, my patellar tendonitis (pain in the kneecap) was due to an imbalance in strength between my various quad muscles.  Likewise, chronic back pain that I experienced on the bike was the result of a weak glute medius.  Through these experiences, I have found that developing a working knowledge of how various muscle groups are connected and interact via anatomy charts from books and/or the internet can help one decide how to adjust one’s strength and/or stretching protocols to address the issue, or failing that, assist medical professionals in narrowing their diagnosis as opposed to relying on trial and error. 

In my next post, we will begin to explore the world of triathlon equipment, with a specific focus on the tools that I’ve found most useful in the training process.  In the meantime, for those of you who would like to follow my training progress, most of my sets can be found on my Strava account at: https://www.strava.com/athletes/15134014.

#dacakeisalie

Entry 5: Rest and Recovery Part 1, Managing Fatigue

Whether it be from PE class growing up or listening to motivational speakers, many of my readers will likely be familiar with the cliché phrase “no pain, no gain”.  While there is certainly a great deal of wisdom in this adage, exercise science would suggest that “pain” (or in endurance parlance – fatigue) is a necessary but insufficient condition to performance “gains” in endurance sports.  The general consensus amongst coaches and sports scientists today is that the human body has an amazing ability to adapt when pushed beyond its physical limits, granted that one does not overly stretch those limits and the body has sufficient time to recover.  This adaptation process is known as supercompensation, whereby when the body experiences microtrauma from an outside stimulus (e.g. exercise), it makes itself more resilient to that stimulus during the process of repairing itself.  As an interesting anecdote, the primary reason why certain athletes have (shamefully) utilized banned substances such as anabolic steroids and testosterone to make illicit gains was not because these compounds made them stronger, but rather allowed their bodies to recover faster between bouts of exercise.  Unethical practices aside, my n=1 experience from my own training process suggests that managing fatigue may be as important as the actual workouts themselves, having made the all-too common mistake of pushing my body beyond the point that was productive. TLDR: no pain + recovery, no gain.   

Training Plan Implications

With all this in mind, the training plan I have outlined in previous posts takes into careful consideration the importance of recovery via three specific elements regarded as best practice by many coaches: 

  • Rest Days: Every training week includes one day completely off from any form of exercise.  This typically takes place on Mondays after the weekend’s longer / tougher sessions and is designed to allow sufficient time to regroup for another week in the trenches. 
  • Recovery Weeks: At a macro level, my season is structured into four-week mesocycles comprising of three weeks of increasing training load, followed by one week of recovery, which usually entails a ~50% reduction in volume.  Like individual rest days, recovery weeks are key to allowing bodily adaptations to occur after a difficult mesocycle. 
  • Race Taper: In the final weeks / month leading up to a race, it is generally considered best practice to execute what is known as a “taper” protocol by drastically reducing one’s training volume while maintaining intensity.  While this does reduce overall fitness, it also has the effect of reducing residual fatigue at a much faster rate, helping to ensure fresh legs for race day. 

Measuring Fatigue – Coggan PMC Model:

Dr. Andrew Coggan

For those of you who would like to dive down the rabbit hole, the general recovery practices outlined above are informed by a diligent monitoring process of certain metrics.  Utilizing the training metrics outlined in my previous post in conjunction with fitness tracking technology and software (to be addressed in a subsequent post), it is possible to quantify and therefore manage one’s accumulated fatigue.  The most well-known and commonly used methodology is the performance management chart or “PMC” model developed by Dr. Andrew Coggan, which hinges upon an alphabet soup of four metrics: 

  • TSS: At its core, the PMC calculates a training stress score (“TSS”) for every workout based on the intensity of the session relative to one’s lactate threshold and the duration of the session, specifically:

As seen above, the TSS of a session rises as one increases the intensity and/or duration of a workout.  To provide some examples, spending 1 hour at an intensity equal to threshold yields a TSS of 100%*100*1 hour = 100.  Likewise, spending 2 hours at an intensity equivalent to 75% of threshold yields a TSS of 75%*100*2 hours = 150. 

  • CTL (Fitness): It goes without saying that as an athlete becomes stronger, he or she is able to go harder and/or longer during training sessions, which is reflected in the data via higher TSS numbers on any given day.  This is most often summarized in a metric known as chronic training load (“CTL”), which is one’s weighted average daily TSS over the past 42 days with the most recent days being more heavily weighted.  For the math geeks out there, the formula for CTL looks like this:

Here, CTLy represents yesterday’s CTL and TSS represents current training stress score.

  • ATL (Fatigue): In a similar manner, TSS can also be used to approximate the amount of fatigue one has generated in the short term, also known as acute training load (“ATL”).  This is calculated in the same way as CTL except weighted over the past 7 days:

Given the difference in weighted average days (42 vs 7), trends in CTL generally tend to lag behind those of ATL. 

  • TSB (Form): If one sticks with the crude analogy of treating CTL as “fitness” and ATL as “fatigue”, the difference between the two, known as training stress balance (“TSB”) can be used to approximate one’s “form” or “freshness” as seen below:

Taken together, these metrics are incredibly useful for tracking the progress of one’s training and knowing when it is appropriate to back off the overall load.  For example, a general rule of thumb is that qualifying for Kona (as of the 2019-2020 season) usually requires a minimum peak weekly TSS of 1,000, which equates to a CTL of approximately 140-150.  As one strives toward that goal by steadily progressing in both intensity and duration, given the aforementioned lag between ATL and CTL, one should see ATL exceed CTL, resulting in a negative TSB value, i.e. an indication of a rising trend in fitness.  Conversely, a positive TSB value is usually an indication of a falling trend in fitness.  That being said, an overly negative TSB is oftentimes an indication of training beyond the point of productivity.  While the exact “breaking point” TSB value varies from person to person, most coaches generally guide towards maintaining a TSB value above -30. 

To put this all into context, below is a screenshot of my personal PMC for my preparation for Ironman Wisconsin last year as well as my training so far for Kona.  Here, the blue line represents CTL (fitness), the pink line represents ATL (fatigue) and the yellow line represents TSB (form). 

Using the training plan described in prior posts, I grew CTL from a value of 68 at the beginning of my season (August 2018) to a peak value of 180 one month prior to Ironman Wisconsin (August 2019).  This progression was by no means linear, as one can easily spot a pattern of ATL “spikes”, each representing a week of training terminated by a rest day.  These spikes also tend to occur in sets of three, representing the three-week loading phase of each mesocycle, which is immediately followed by the aforementioned recovery week.  Both the rest days and recovery weeks ensure that TSB remains higher than -40 at all times and has a chance to return to a neutral value of zero on a periodic basis, thus ensuring that the body has adequate time to adapt to the increased intensity and volume.  The threshold TSB value of -40 was determined via a lengthy process of trial and error over three seasons, below which I have historically experienced drops in performance as well as a greater propensity for injury (more on this on a subsequent post). 

After achieving this peak CTL value of 180, I executed a month-long taper process which drove a slight reduction in CTL but also a very large swing in TSB to a value of +25, ensuring that I was rested and ready for what turned out to be a successful, Kona-qualifying race.  This chart also clearly shows the effects of detraining: having taken some time off in the weeks following Ironman Wisconsin, one can see a rapid rise in TSB as well as reduction in both ATL and CTL. 

Limitations / Alternatives

It should be noted however that the Coggan PMC model is not without its limits.  For example, while the PMC does a great job of tracking the stress generated from workouts, it does not capture the stress derived from activities outside training such as on the job or one’s domestic life.  My personal experience would suggest that willpower applied to any activity, whether it be for work, training, or social events, is drawn from the same “battery”, and these outside activities do have a material effect on how quickly one can ramp one’s training load.

In addition, many coaches would be quick to point out that not all TSS is created equal.  For example, one’s physiological adaptation from an easy 2 hour ride at 50% threshold would be very different from an hour ride involving hard intervals at 120% of threshold despite the fact that both workouts have a TSS of 100.  As such, TSS is only useful for tracking fatigue if one maintains a consistent mix of workouts over time. 

It should also be noted that there exist alternative ways to measure one’s fatigue levels.  For example, one’s resting heart rate tends to remain elevated when the body does not have sufficient time to recover.  More recently, several companies have advertised the use of heart rate variability, i.e. the variability in the timing between individual heart beats (a lower number usually indicates a high stress load and vice versa). 

In my next post, we will continue this exploration of rest and recovery by taking a closer look at the actual activities they entail.  In the meantime, for those of you who would like to follow my training progress, most of my sets can be found on my Strava account at: https://www.strava.com/athletes/15134014.

#dacakeisalie

Entry 4: Training Plan Part 2, Deliberate Practice

In her 2016 book “Grit: The Power of Passion and Perseverance”, University of Pennsylvania psychology professor Angela Duckworth modifies the theory popularized by Malcolm Gladwell that achieving world class expertise and/or success in a particular field requires 10,000 hours of repetition in that field.  While she does not disagree with the volume of repetitions required, Ms. Duckworth adds as an additional necessary condition the need for deliberate, high quality practice, i.e. practice with purposeful knowledge of the specific goals and objectives of each session.  While I leave it to my readers to decide on the scientific validity of these theories, my anecdotal experience from Ironman training suggests that deliberate practice is useful for maximizing the productivity of one’s individual sessions and critical to breaking through the inevitable performance plateau as one progresses deeper into the diminishing return curve.  TLDR: practice makes permanent, not perfect!

Training Metrics:

Before we dive into the purpose of the individual training sessions outlined in my previous post, an introduction to the basics of exercise science and training methodologies is in order.  In the realm of endurance sports, two metrics are generally regarded as the strongest predictors of performance:

  • VO2Max: Expressed in mL/kg/min, VO2Max measures the maximum amount of oxygen that one can utilize during intense exercise.  In laymen’s terms, this can be thought of as the size of one’s “aerobic engine” (for car buffs out there, think of this as similar to the difference between a 5.0L V8 vs. a 3.0L V6 engine).  The below table provides benchmark VO2Max values based on age and gender.  For example, for the general population of 30 year old males, the average VO2Max value is generally around 44mL/kg/min. 
Highest recorded VO2Max values

Professional endurance athletes typically exhibit numbers far beyond these benchmarks, the highest recorded values of which are provided in the accompanying table.  By comparison, typical values for Kona-qualifying age-group athletes range in the 65-70 range. 

VO2Max has traditionally been considered to be a largely static number, the strongest determinants being one’s genetics, age, gender, and whether or not one smokes (smoking results in a permanent reduction in VO2Max!).  However, more recent research suggests that this metric is trainable, with improvements as high as 40% over several years seen in some cases.  One can have one’s VO2Max tested at many full-service gyms and medical facilities, which involves donning a gas exchange mask (affectionately dubbed the “Bane” or “Darth Vader” mask by technicians) and either running or cycling at a progressively harder intensity until failure.  Those having completed the VO2Max test in the past would likely describe it as one of their more dreaded experiences.  As a point of reference, my most recent running VO2Max test in February 2018 yielded a value of 70mL/kg/min at a heart rate of approximately 185bpm. 

VO2Max test: the “Bane Mask”
  • Lactate Threshold: Going back to the car analogy, if one thinks of VO2Max as the size of one’s aerobic engine, lactate threshold measures how many cylinders in that engine can be utilized over extended periods of time.  As one increases the intensity of exercise, the body derives proportionally more energy from sugar instead of fat via a process known as aerobic respiration.  Two of the byproducts of aerobic respiration are hydrogen ions and lactate, the former of which causes one’s blood to become more acidic, resulting in the unpleasant, “burning” sensation one experiences under intense load.  Eventually, the intensity of exercise becomes so great that it overwhelms the body’s ability to clear these byproducts, forcing the body to slow down.  This inflection point is known as the lactate threshold, beyond which one’s ability to maintain a certain intensity level drops rapidly from hours to minutes.  For this reason, lactate threshold is often viewed as the key limiting factor to performance in endurance sports, the goal being to increase one’s ability to operate at faster paces before one’s effort level hits lactate threshold.  Depending on the sport, lactate threshold is traditionally measured as the heart rate / pacing / power that one can maintain for an hour (multiple measurement protocols lasting far less than an hour exist but are beyond the scope of this post).  As a point of reference, my lactate threshold figures in the lead-up to Ironman Wisconsin last year were 1:30 minutes per 100M in the swim, 290 watts / 165bpm on the bike, and 6:15 minutes per mile / 175bpm on the run. 

Training Zones:

Once one has determined one’s VO2Max and lactate threshold figures, it is possible to establish training “zones”, which are typically expressed as a percentage of the aforementioned metrics.  For this reason, these zones are highly personalized to each individual and their current fitness level.  A summary of these zones is provided below based on the most commonly used 7-zone model developed by Dr. Andrew Coggan. 

  • Zone 1 (Active Recovery): In terms of perceived effort level, one can effectively continue to operate at this pace indefinitely.  Often prescribed by coaches between hard intervals or as standalone workouts, spending time in Zone 1 allows the body to clear out metabolic byproducts generated from previous strenuous efforts more quickly than if one simply did nothing. 
  • Zone 2 (Endurance): Often described as an easy, conversational, nose-breathing pace, this is the intensity level at which most Ironman distance athletes operate on race-day.  Commonly referred to as the “fat burning zone”, Zone 2 training promotes the metabolization of fat for energy, which unlike sugar is effectively an infinite resource for a single day race.  This allows one to spare sugar stores for “surge” efforts.  Training in Zone 2 also promotes the development of a greater mitochondria count (the “powerhouses of the cell” per high school biology) in one’s muscle cells, which in turn allows the body to process more oxygen and boost one’s VO2Max.  Spending long periods of time at this zone also builds resistance to fatigue (the tendency for output to fall for a given effort or effort to rise for a given output) across all effort levels. 
  • Zone 3 (Tempo): At this pace, conversation begins to get difficult and one often experiences an involuntary shift to a faster breathing pattern.  Zone 3 is the pace at which most Olympic and half-Ironman distance athletes spend their time in on race-day.  Often demonized as the “grey zone” or the “Zone 3 trap”, this is the effort level that many new athletes subconsciously default to if they are not disciplined enough to stay in Zone 2 or too tired to maintain Zone 4-5.  This can often lead to performance plateaus given that Zone 3 provides the benefits of Zones 2, 4, and 5 but at a reduced level relative to the amount of fatigue it generates.  Nevertheless, training specific points of Zone 3 can be used strategically.  For example, training right at the boundary between Zone 2-3 can be extremely beneficial to pushing back the transition point between fat and sugar metabolization.  Similarly, training right at the boundary between Zone 3-4 (sometimes referred to as “sweet spot” training) can help push one’s lactate threshold upward without the shellshock typically experienced by training in pure Zone 4. 
  • Zone 4 (Threshold): Mental concentration becomes required just to maintain this pace and conversation becomes very difficult.  One will feel a burning sensation in one’s muscles as time continues and the perceived effort level gradually increases from hard to excruciating if maintained over the course of an hour as lactate levels reach critical levels.  Training at lactate threshold helps to promote both mental tolerance and the body’s ability to clear hydrogen ions and lactate from the system, leading to direct gains in performance at lactate threshold itself. 
  • Zone 5 (VO2Max): This is a lung-busting effort level that one typically encounters at many HIIT studios such as Barry’s and Crossfit and can be typically maintained for only 3-8 minutes without rest.  While training in Zone 2 increases VO2Max by increasing one’s mitochondria count, actually training at VO2Max increases the efficiency of each one of those mitochondria, providing further enhancements to one’s aerobic ceiling and allowing for further room for gains in lactate threshold. 
  • Zone 6 (Anaerobic): Best described as a “long-distance” sprint effort, training in Zone 6 promotes the body’s ability to operate at and quickly recover from anaerobic efforts, i.e. beyond its ability to utilize oxygen.  This is useful in shorter races such as criteriums, which often involve multiple short, sharp surges to bridge gaps in the field. 
  • Zone 7 (Neuromuscular): Often described as an all-out sprint effort, training in Zone 7 is similar to heavy weight training in that it promotes the recruitment of previously untapped muscle fibers. 

Zone Distribution:

Once an athlete has established his/her training zones, the question then becomes how much time one should spend in each zone given a finite budget of training hours.   Over the years, a large number of coaching models have been developed, the most popular of which are summarized below. 

  • Traditional: Sometimes referred to as “pyramidal” training, this methodology involves spending the majority of training hours at or below Zone 2, and progressively less volume at higher intensity zones.  The rationale of this model is that the benefits of higher intensities are maximized when one has established a strong fitness base (e.g. increasing mitochondrial efficiency via Zone 5 training is more effective if there are more mitochondria to begin with via Zone 2 training).  While successfully utilized by many coaches and athletes, this methodology does require a large time commitment in order to accumulate the necessary training volume in Zone 2. 
  • Threshold: Also known as “sweet spot” training, this methodology involves spending the majority of training hours at the boundary between Zones 3 and 4.  This is often prescribed by coaches to time-crunched athletes, as training at this intensity is believed to provide the most “bang for buck”, i.e. most of the benefits of Zones 2, 4, and 5 while still being maintainable at a lower training volume.  However, these benefits are not as scalable at higher training volume levels.    
  • High Intensity Interval Training (“HIIT”): Popularized by Emil Zatopek, a long-distance runner who won gold medals in the 5K, 10K, and marathon distance at the 1952 Helsinki Olympics, HIIT training involves spending the majority of one’s time training at Zone 4 or harder.  Based on the reasoning that “in order to race fast, one needs to train fast”, this methodology was later dropped by subsequent generations of endurance athletes who found that it made them more prone to injuries at higher training volumes.  HIIT has nevertheless enjoyed a resurgence in recent years amongst fitness studios (e.g. Barry’s and Crossfit) due to the immense weight-loss benefits it provides by increasing both insulin and leptin (anti-hunger hormone) sensitivity. 
  • Polarized: Touted as the latest development in the endurance coaching world, polarized training involves spending the vast majority (~80%) of one’s training time in Zone 2 and the remainder (~20%) in Zone 5 or higher.  This model has been spearheaded by Dr. Stephen Seiler, whose research suggests that most elite endurance athletes utilize this distribution.  More so than the traditional method, this methodology requires a very large time commitment not only to accumulate the necessary amount of time in Zone 2, but also to allow sufficient recovery from the higher intensity sessions it prescribes. 

Kona Training Plan Revisited:

With the underlying sports metrics and science established, we can now more thoroughly examine the purpose of the individual training sessions outlined in my previous post.  Overall, the plan that I’ve laid out for myself follows the traditional model, i.e. the majority of training hours are spent at or below Zone 2, and progressively less volume is spent at higher intensity zones. 

Cycling: My weekly bike regimen is comprised of the following 4 rides:

  • Long, easy zone 2 (65-75% threshold) ride:  Over the course of the season, this will steadily increase from 2.5 hours to 6 hours in 15 minute increments on a roughly monthly basis.  In addition to the aforementioned metabolic, mitochondrial, and fatigue resistance benefits described above, this workout is critical to building the mental stamina to “go the distance” and allowing the body to adapt to the aero position. 
  • Continuous high-zone 2 / low-zone 3 (80-85% threshold) brick ride: Over the course of the season, this will increase from 1.25 hours to 2 hours on a quarterly basis.  Training right at the boundary between Zone 2-3 helps to push back the transition point between fat and sugar metabolization.  Running immediately after (known as a brick session) assists the body in adapting to the unpleasant “dead-leg” sensation of activating a different set of muscles when transitioning from bike to run. 
  • Sweet spot (88-94% threshold) interval ride: Over the course of the season, this will increase from 3×12 minutes over 1 hour to 6×15 minutes over 2 hours on a monthly basis.  Training at the boundary between zone 3-4 helps to push one’s lactate threshold upward.  While pure zone-4 intervals would certainly be more potent for this purpose, my historical experience has been that such sessions have left me too tired to successfully execute subsequent workouts. 
  • Super-threshold interval ride: Over the course of the season, this evolves from sets of maximal 20 second sprints to promote additional muscle recruitment to eventually 6×3 minutes at VO2Max (~120% threshold) to push aerobic capacity higher and allow more room for further improvements in performance at lactate threshold. 

As mentioned in my 2nd post, my goal for the bike is to be able to generate a lactate threshold power of 300 watts by race day.  Rather than periodically assess lactate threshold with a lab test (expensive and inconvenient), my approach has been to bump up my threshold power benchmark by 1-2 watts when the following criteria are met:

  • Long ride executed at a heart rate less than 147bpm and with less than a 6% upward drift in heart rate over the course of the workout                   
  • Continuous high-zone 2 / low-zone 3 ride executed at a heart rate of less than 150bpm
  • Sweet spot ride executed at a heart rate of less than 160bpm
  • Super-threshold ride successfully completed at prescribed power

Running: My weekly run regimen is comprised of the following 4 sessions:

  • Long zone 2 run: Over the course of the season, this will increase from 1.5 to 3 hours in 5 minute increments on a roughly weekly basis.  Due to running’s high impact, unlike with cycling and swimming, the limiting factor to run performance is not cardiovascular but rather the durability of one’s tendons and ligaments.  As such, one of the most common mistakes made by new runners is getting injured (e.g. runner’s knee or shin splints) because they increased their mileage too quickly.  For this reason, most coaches generally recommend that one increases run mileage by no more than 10% per week.  A properly ramped long-run session greatly assists in developing the necessary durability to last the distance. 
  • Super-threshold interval run: Over the course of the season, this will progress from 2×20 second maximal sprints to promote additional muscle recruitment to eventually 6×4 minutes at VO2Max (~120% threshold) to push aerobic capacity higher.
  • Zone 2 brick run: Over the course of the season, this will increase from 20 minutes to 1 hour.  In addition to accumulating additional mileage, running immediately after a bike ride assists the body in adapting to the unpleasant “dead-leg” sensation of activating a different set of muscles. 
  • Zone 1-2 recovery run: Over the course of the season, this will increase from 30 minutes to 45 minutes. This is meant to be a very easy run to accumulate additional mileage as well as allow the body to clear out metabolic byproducts generated from previous strenuous efforts.

Similar to the bike, rather than periodically assess lactate threshold with a lab test, my approach has been to bump up my threshold pacing when I am able to complete my long run at a heart rate below 157bpm, the goal being to be able to eventually execute that session at 6:52 minutes per mile. 

Swimming: Because of their shorter duration and low impact, coaches tend to prescribe swim sessions with a mix of elements (e.g. technique drills, long endurance intervals, and short speedwork) in order to target multiple adaptations.  That being said, my weekly swim regimen is comprised of 3 sessions that tend to have a specific emphasis:

  • Technique-focused swim:  This swim is mostly comprised of drills that target specific elements of the front crawl stroke as well as some longer endurance work.  This swim will typically range between 2,500 to 3,000m.  On a monthly basis, I substitute this workout with a swim lesson with video analysis.  These lessons take place in an endless pool (think a treadmill for swimming) with 360 degree video coverage and underwater mirrors to allow athletes to observe their own stroke.  I have found these sessions to be incredibly helpful in that they provide immediate feedback on the discrepancy between what I think vs. what I am actually doing underwater.  Illustration below:
What I think I look like…
  • Two endurance / speedwork swims: These sessions are primarily comprised of long endurance intervals (200m+) but also incorporate some sprint intervals to promote a faster cadence and arm turnover.  Over the course of the season, these swims will slowly progress from 2,500 to over 5,000m.  As the weather improves in the spring and summer, one of these sessions will be substituted with an open water swim to provide an opportunity to train more race specific techniques (e.g. sighting/navigation, choppy conditions, etc.)

In my next post, I will dive into an oft-overlooked part of Ironman training: rest and recovery.  In the meantime, for those of you who would like to follow my training progress, most of my sets can be found on my Strava account at: https://www.strava.com/athletes/15134014.

#dacakeisalie

Entry 3: Training Plan Part 1, Cultivating Consistency

Through discipline comes freedom – Aristotle

The Benefits of a Training Plan

As crazy as the prospect of swimming 2.4 miles, cycling 112 miles, and running 26.2 miles sounds, like many other challenges, the Ironman is an undertaking which can be broken down into a series of more manageable tasks that can then be steadily ticked off on a daily basis.  While there is an endless variety of recommendations on how to approach preparing for an Ironman (which we will explore in a subsequent post), the common thread amongst most coaches and physiologists is that ahead of any specific guidance on training intensity or volume, training consistency is perhaps the most important determinant of success.  Having schlepped through three seasons and made a large number of newbie mistakes along the way, my limited n=1 experience in the sport to date would suggest that this is indeed the case. 

In terms of establishing this consistency, many have asked me where one can find the daily motivation to tackle the training grind, to which my response has been that I have found motivation to be a very unreliable phenomenon that comes and goes on its own accord.  I would be the first to admit that there have been many days when I wanted nothing more than to curl up under the duvet or to blow off an intimidating training set in favor of an evening of Netflix (I must give props to my swimmer friends as I am hard pressed to think of a less pleasant feeling than the initial plunge into a cold pool at 5am!).  In place of motivation, I have found that a far more dependable path to cultivating training consistency is establishing a set of routines and habits.  Although one of the more colorful characters in the endurance community, the Vegan Cyclist summarizes this far more humbly and eloquently than I can in the following video:

Given that no-one is born with habits and as someone who is as prone to laziness and inertia as everyone else, I have found that establishing a training plan beforehand, whether one works directly with a coach or uses a boilerplate regimen sourced online, is an effective way to establish a system of accountability.  In addition to taking out the guesswork and potential friction of deciding what one needs to do on any given day, I have also found that following a training plan is an effective safeguard against burning oneself out through overtraining.  When paired with the latest online applications such as TrainingPeaks or Strava, which allow athletes to track their gains in fitness, share with coaches and friends, and identify areas of strength and weakness, following a training plan in many ways allows one to “gameify” the training process, which in turn promotes greater compliance and thus more firmly establish consistency. 

Kona Training Plan

With this context in place, my training plan for Kona is by and large the same as the regimen I had followed for IM Wisconsin last year.  At a macro level, my season is structured into four-week mesocycles comprising of three weeks of the sessions outlined below, followed by 1 week of recovery (approximately a 50% reduction in volume).  A typical training week consists of the following sessions:

  • 4 bike rides:
    • 1 long (easy effort) ride
    • 1 continuous tempo (medium effort) brick session (bike followed by run)
    • 1 sub-threshold (hard effort) interval ride
    • 1 super-threshold (maximal effort) interval ride
  • 3 swims:
    • 1 technique-focused swim comprised mostly of drills
    • 2 endurance-focused swims featuring longer intervals
  • 4 runs:
    • 1 long (easy effort) run
    • 1 speed (hard-maximal effort) interval run
    • 1 brick run (preceded by bike)
    • 1 recovery (very easy effort) run

As a further illustration, the below screenshots from my TrainingPeaks account provide a good overview of what a typical early and late season training week look like.   

Early Season Week
Late Season Week

We will conduct a deeper dive into the exact makeup and progression of each of these sessions in a later post, but at a high level, this training season calls for a steady progression from approximately 11 hours of volume per week today (November 2019) to 20 hours per week three weeks prior to Kona (early September 2020).  In those final three weeks, one generally executes what is known as a “taper” protocol by drastically reducing volume while maintaining intensity in order to shed residual fatigue and ensure fresh legs for race day. 

Many who are interested into getting in the sport have often asked for my recommendation on what is the “best” or most effective training plan.  Going back to the theme of cultivating consistency, my answer to this question has been whatever plan one believes he/she can follow with maximum compliance.  It goes without saying that we are all subject to the inherent uncertainties of everyday life, including but not limited to career demands, family obligations, social calls, etc.  Nevertheless, both the number of sessions and volume levels prescribed by the plan I’ve laid out for myself above have been carefully chosen to take these factors into account.  For example, each week has inbuilt flexibility by including one day completely off and one day with only one shorter training session, both of which can be moved around to accommodate events such as travel, meetings, and social gatherings.  In addition, this plan has been stress tested to a “surge capacity” scenario at work of 80 hours per week and a conservative minimum sleep requirement of 8 hours per day:

While everyone’s work demands and life situation can vary significantly (major respect to those of you who have kids!), the math I’ve laid out here hopefully shows the possibilities if one is judicious with one’s time.  At a minimum, the math demonstrates that an unmarried, New York based, 29-year-old male with a relatively high-demand job should be able to maintain a Kona-qualifying training regimen.  I should state however, that although triathlon is an individual sport, it should by no means be a lonely one.  A major lesson that I’ve learned over the past few seasons has been the importance building a strong support team around oneself by cultivating buy-in and an understanding of one’s goals from friends, family and coworkers.  This sense of community is extremely powerful, and was most certainly a contributing factor to my success in the sport thus far. 

In my next post, I will conduct a deeper dive into the metrics and science behind endurance performance and how those inform the makeup of the individual training sessions outlined in this post.  In the meantime, for those of you who would like to follow my training progress, most of my sets can be found on my Strava account at: https://www.strava.com/athletes/15134014.

#dacakeisalie